SWB Superpower: Solar + Wind+ storage & DSM vs. gas
Executive summary
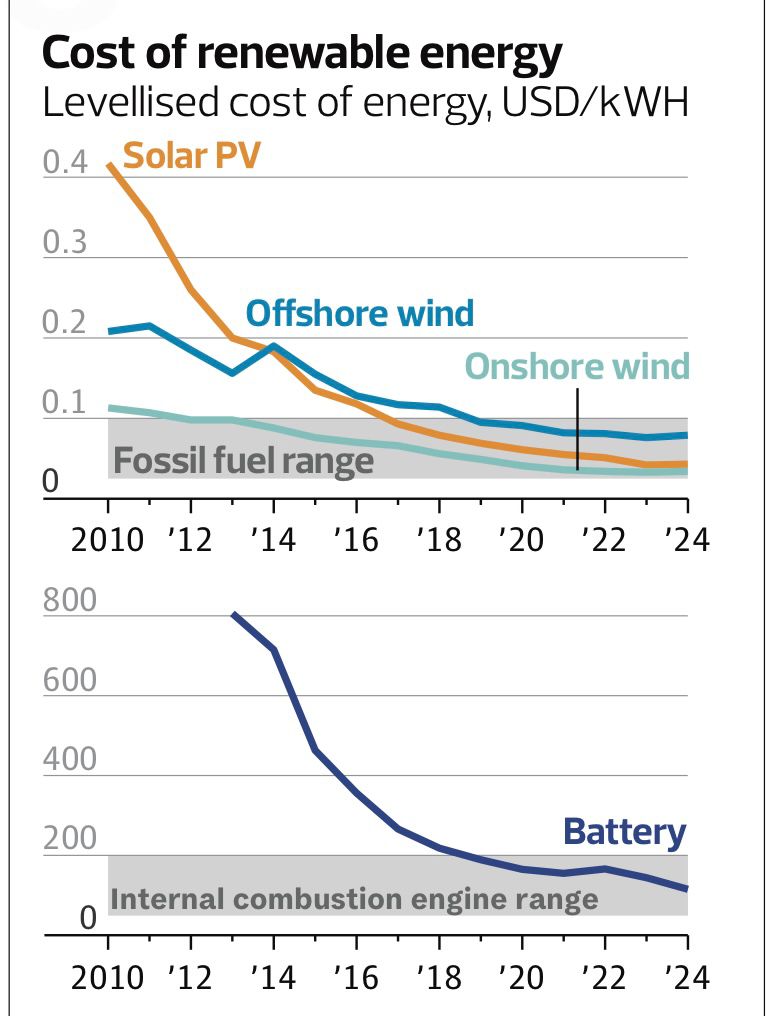
This graph appeared in the Observer on Sunday. There is no doubt that renewables produce the cheaper electricity than fossil fuels, but it’s important to acknowledge that that isn’t the full story. Renewables are well known to be intermittent and there are several periods of so-called Dunkelflaute.
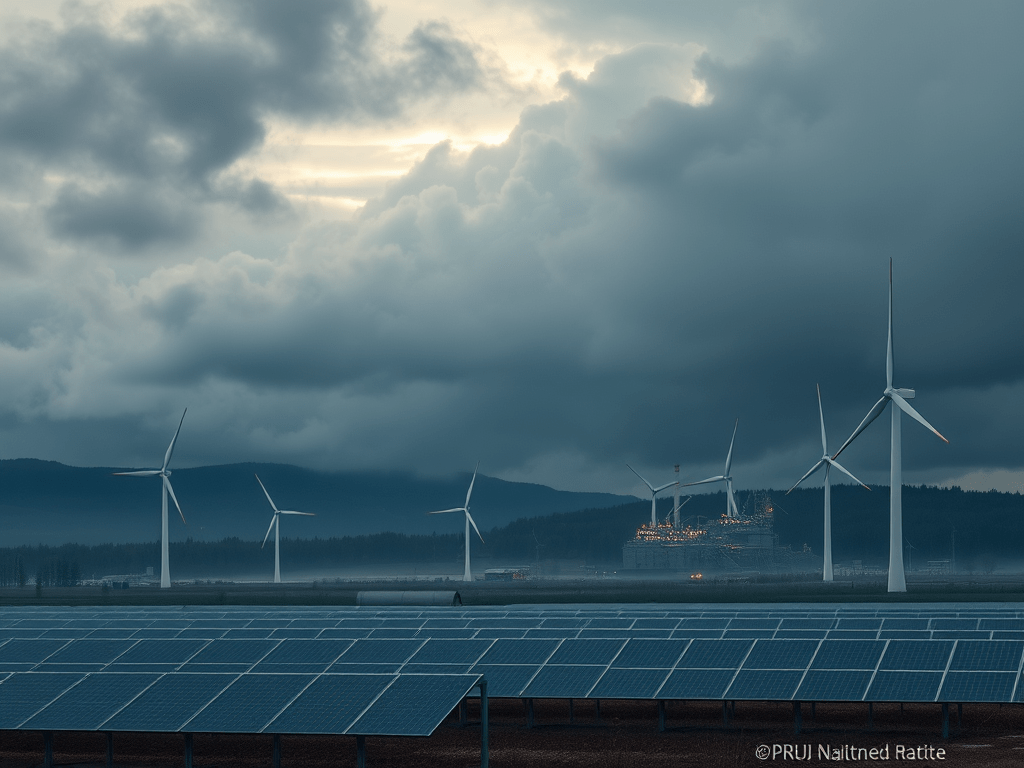
Dunkelflaute is typically linked to static high‑pressure systems that bring weak winds and heavy cloud cover. Meteorologists sometimes call this anticyclonic gloom. They can last from hours to several days, with large regional coverage. Studies suggest they amount to roughly 100–200 hours per year of significantly reduced wind and solar output in the UK. There are 2–10 events per year in northern Europe, most often between October and February and each can last 12–72 hours, occasionally longer. During these periods, renewable generation can fall to below 5–10% of installed capacity, forcing reliance on gas, nuclear, imports, or storage.
Short‑duration batteries can cover peaks, but multi‑day Dunkelflauten require long‑duration storage (hydrogen, pumped hydro, liquid air). Meanwhile, demand-side management (DSM), shifting or reducing demand is being successfully trialled and can save £3–8bn/year by 2050 in avoided system costs.
Climate skeptics, as well as those of us who seek to understand the system and economic implications of the energy transition, consider these low renewables periods, though the former as a reason to not proceed rather than as a challenge to overcome. Without this adequate backup, Dunkelflaute can trigger supply stress during cold snaps when heating demand is also high. Gas prices and carbon costs surge during these events, raising wholesale electricity prices. The naysayers often state that we need 100% of the wind and solar capacity to be backed up by fossil fuel capacity.
Is it true to say that we need 100% backup for renewables on the system?
The short answer is No.
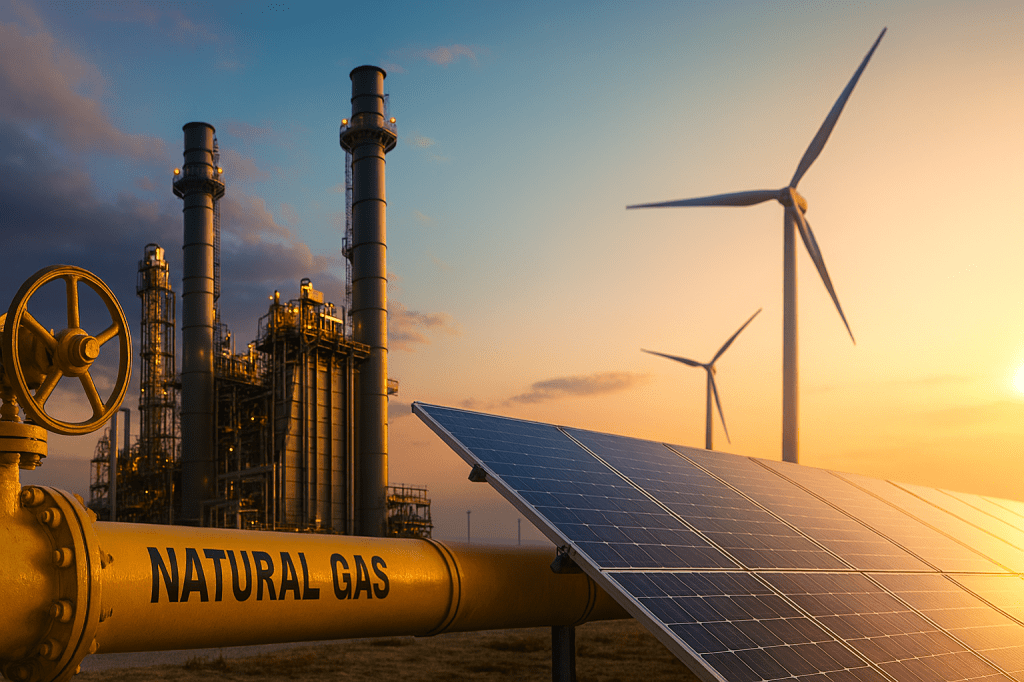
What we need is firm capacity to cover demand during low‑renewable periods, but that can be provided by a mix of gas, nuclear, storage, interconnectors, and demand‑side management. Gas turbines are one option, but not the only one, and need not be sized to match total renewable capacity.
Why not “full backup”?
There are many mitigation factors that mean that relatively little back up is required. While we don’t have all we need yet, nor are we fully reliant on renewables. The mitigations are coming on stream in parallel with increased dependence on renewables
- Dunkelflaute are predictable. Knowing they are coming allows mitigation to be triggered in advance.
- Renewables don’t all vanish at once: Even in a Dunkelflaute, wind and solar output rarely drop to zero everywhere. There’s always some contribution, especially in a geographically diverse generation mix such as wind farms on the East and West cost of our island nation as well as in the Highlands
- System diversity: UK generation includes nuclear, biomass, hydro, and imports. These provide firm baseload and reduce the need for gas backup.
- Storage: Batteries (both grid scale and domestic), hydrogen, pumped hydro, and flexible demand can cover shortfalls. These reduce the amount of gas capacity needed.
- Demand Side Management (DSM): National Grid ESO reported up to roughly 1.6–2.0 GW of demand reduction at peak across successful Demand Side Management trial sessions in winter 2022/23, with multi‑GWh shifted or avoided; the service continued into winter 2023/24 with similar magnitudes. ESO projects that Demand Side Management alone could provide around 4–6 GW (~15% of worst case demand) of flexible capacity by 2030, rising to 5-8 GW (25%) in 2050.
- Bidirectional electric vehicles (vehicle‑to‑grid, V2G) could provide a further 5–10 GW of flexible capacity in the UK by 2030.
- Capacity vs energy: Gas turbines are valued for capacity (being available when needed), not for matching the entire renewable fleet’s output. The system is designed around peak demand, not total installed renewable capacity.

What’s next?How do we get to 100%
A UK system built around wind/solar complemented by diversified storage and demand-side management (DSM), with grid upgrades amortised over 25 years, is likely to deliver lower and more stable whole‑system costs than a gas‑dependent pathway, while cutting health and environmental externalities and exposure to fuel volatility.
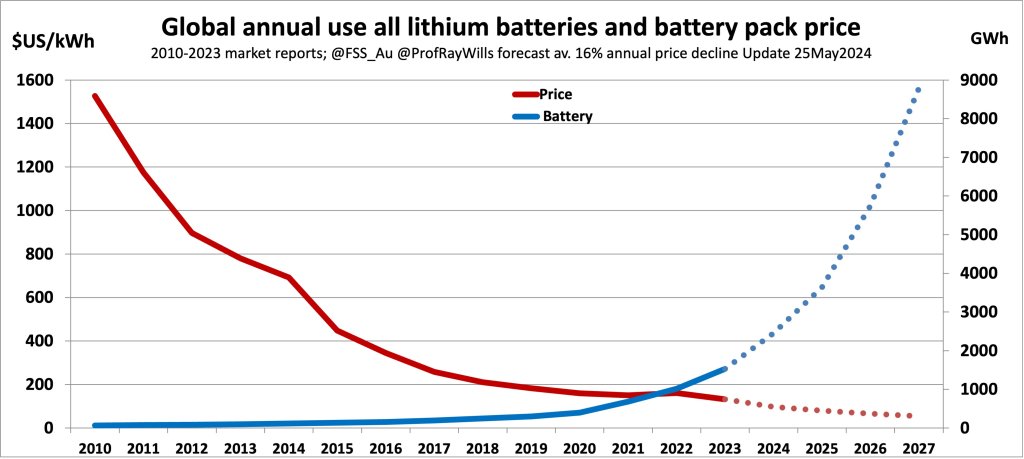
Battery storage costs have collapsed far faster than most forecasts, transforming the economics of grid flexibility. In 2020, turnkey lithium‑ion systems cost around US$400–600/kWh, but by 2024 that had fallen to US$165–275/kWh, with China already below US$100/kWh. Analysts at BloombergNEF and IRENA expect costs to halve again by 2030, reaching US$80–120/kWh, making batteries competitive with peaking gas plants once carbon costs are factored in.
These projections don’t yet include CATL’s sodium‑ion breakthrough, which claims cell‑level costs as low as US$19/kWh; if commercialised at scale, sodium could drive system‑level costs down to US$50–80/kWh, opening the door to affordable multi‑day storage and reshaping how the UK tackles Dunkelflaute events and net zero reliability.
Combine this with DSM to reduce peak and infrastructure needs.
Gas retains near‑term dispatchability value, but its cost and externalities tilt the balance toward a renewables‑led system with firm low‑carbon flexibility. Add the substantial health costs of fossil fuels and it makes for a compelling argument to proceed with the transition.
| Category | 2025 (indicative) | 2035 (indicative) | 2050 (indicative) |
|---|---|---|---|
| Installed renewables (nameplate) | ~60–75 GW (wind ~35–40; solar ~20–25) | ~100–130 GW (offshore wind led; solar scaled) | ~140–180 GW (high-renewables system) |
| Expected average output (normal conditions) | ~20–30 GW | ~35–50 GW | ~50–70 GW |
| Firm low‑carbon capacity (nuclear, biomass, hydro) | ~10–12 GW (nuclear ~6; biomass/hydro ~4–6) | ~15–20 GW (Hinkley Point C online; modest biomass/hydro) | ~20–25 GW (additional nuclear or firm low‑carbon) |
| Gas backup capacity (CCGT + peakers) | ~30–35 GW available; high utilisation | ~25–35 GW available; lower utilisation; some CCS | ~15–25 GW available; low utilisation; CCS/bio‑methane blends |
| Storage capacity (power rating) | ~3–6 GW (batteries + pumped hydro) | ~15–25 GW (short-duration batteries + early long-duration) | ~25–40 GW (diversified, incl. long-duration) |
| Storage energy (duration) | ~6–10 GWh (batteries) + legacy pumped hydro | ~50–150 GWh (mixed durations) | ~200–500+ GWh (incl. long-duration stores) |
| DSM (responsive demand capacity) | ~1.5–2.0 GW proven in trials | ~3–5 GW (scaled smart tariffs, EVs, heat pumps) | ~5–8 GW (mainstream flexible demand) |
| Interconnectors (import/export capability) | ~7–8 GW | ~10–15 GW | ~15–20 GW |
| EV V2G | Not yet available | 5 – 10 GWh (assume 10–20% of fleet connected and willing to participate at any given time) | |
| Peak demand (winter) | ~45–50 GW | ~45–50 GW (efficiency offsets electrification) | ~50–55 GW (electrification; efficiency moderates) |
| Net firm capacity vs peak (gas need) | Firm low‑carbon + storage + DSM covers ~20–25 GW; gas fills remainder | Firm low‑carbon + storage + DSM covers ~35–45 GW; gas covers residual | Firm low‑carbon + storage + DSM covers ~45–55 GW; minimal gas residual |
| Gas utilisation (energy share) | High on peak days; ~30–40% annual generation | Lower; ~10–20% annual generation (depends on CCS, renewables output) | Minimal; ~5–10% annual generation (insurance role) |
Scenario comparison: core economics and externalities
Lets look at the alternatives of continuing with gas vs transitioning to renewables and a modern energy mix.
| Gas-only pathway | Renewables + storage + DSM pathway | |
|---|---|---|
| Generation cost trend to 2035 | New CCGT LCOE higher than onshore wind/solar (policy-adjusted fuel & carbon costs) | Onshore wind/solar lowest LCOE; continued tech learning expected |
| Flexibility provision | Gas turbines (high fuel/CO₂ cost, price volatility) | Multi-type storage (batteries, hydrogen, pumped, LAES) + DSM; falling costs |
| Grid investment needs | Moderate near-term; less new transmission for variable generation | Higher near-term for reinforcements, digitalisation; amortised over 25 years |
| System cost stability | Exposed to gas price shocks and carbon pricing | Insulated from fuel volatility; more predictable O&M |
| DSM impact | Limited unless adopted; peak remains gas-set | Reduces peak and network upgrades; £3–8bn/year system savings by 2050 |
| Health/environmental externalities | Significant air pollution and climate costs | Substantially lower local air pollution and lifecycle emissions |
Cost trajectories and 25-year amortisation
It would be foolish not to consider the economics. While renewables and storage continue to show substantial cost reductions, the transition costs are not inconsiderable.
Generation costs: UK government estimates continue to show onshore wind and solar as the cheapest new-build options, with learning and scale keeping costs competitive against new fossil generation that faces fuel and carbon price risk. This underpins a renewables‑led build-out even before flexibility add-ons.
Storage costs and roles: Large-scale storage portfolios (short-duration batteries plus long-duration options like hydrogen and other technologies) can economically complement wind/solar to cover residual demand. UK-focused analyses conclude storage compares favourably with low‑carbon alternatives for firming, and diversified storage improves resilience against multi‑day lulls. Battery system costs have fallen steeply (near 89% over the last decade in Europe), with further reductions expected toward 2030, improving arbitrage, peak-shaving, and reserve economics.
Amortising grid upgrades: Ofgem highlights the need to recover system upgrade costs fairly as the UK transitions, reflecting investments in networks and flexibility. Spreading these capital expenditures across 25 years aligns with asset lifetimes and lowers annualised impact on bills while enabling higher renewable penetration and reliability.
Health and environmental externalities
Fossil fuel external costs: The UN/WHO-linked evidence summarised by the UK House of Lords Library notes the heavy health and economic burden of air pollution from fossil fuels, estimated at $2.9 trillion globally in 2018, driven by particulate matter and NO₂, with clear local public health relevance. Transitioning to clean generation reduces these burdens substantially.
UK system decarbonisation progress: Renewables supplied 50.8% of UK electricity in 2024, with low‑carbon generation at a record 65% and fossil generation falling to mid‑20th‑century levels, demonstrating the practical viability of a high‑renewables grid and momentum for further reductions in externalities.
Implications
Factoring falling renewables and storage costs, 25‑year amortisation of grid upgrades, DSM benefits, and health/environmental externalities, a renewables‑plus‑flexibility pathway is economically compelling and strategically prudent for the UK. Gas remains valuable for near‑term dispatchability, but the forward‑looking balance favours building out cheap renewables, scaling diversified storage, and mainstreaming DSM to minimise exposure to fuel volatility and external costs while meeting reliability.
Implementing the transition
Let’s look at some of the key steps to ensure the hand wringing scenarios of the naysayers are averted.
Portfolio design: Combine onshore/offshore wind and solar with a mix of short-duration batteries and long‑duration stores (e.g., hydrogen/LAES/pumped), sized to residual demand distributions.
DSM scale‑up: Accelerate smart tariffs, EV/heat pump flexibility, and industrial load shifting to capture £3–8bn/year savings by 2050.
Network planning: Align transmission and distribution reinforcements with renewable zones and storage hubs; recover costs over 25 years per Ofgem’s fairness lens.
Risk management: Hedge gas exposure only where it delivers net reliability value; prioritise zero‑fuel marginal generation to stabilise bills.
Conclusion
Far from being a recipe for blackouts, renewables backed by storage, smart demand and interconnectors are building a system that’s cleaner, cheaper and more reliable.
The old idea that we must keep every gas plant on standby ‘just in case’ is fading fast; by 2030 flexible demand, batteries and EVs will already be covering a big share of the gaps. The future isn’t about clinging to fossil insurance, it’s about designing resilience into the grid itself, so we stay on the front foot and power the UK securely without the carbon baggage.”
“Renewables aren’t a blackout risk — with storage, smart demand and interconnectors, they’re the backbone of a cleaner, cheaper and more reliable grid.”
Notes and sources
Interconnector capacity plans and GB market insights:
https://www.ofgem.gov.uk/energy-policy-and-regulation/interconnectors:
National Grid ESO’s Future Energy Scenarios outline pathways to a predominantly low‑carbon grid by 2035, with firm capacity coming from a mix of nuclear, storage, interconnectors, and flexible demand rather than one‑for‑one gas backup. https://www.nationalgrideso.com/future-energy/future-energy-scenarios
UK Government energy National Policy Statements (including EN‑3 for renewables and EN‑5 for electricity networks) frame the need for grid reinforcements and diversified flexibility.
https://www.gov.uk/government/collections/energy-national-policy-statements
Electrical Review summarised the UK position that new gas plants act as “insurance” for security of supply, not one‑for‑one renewables backup. https://electricalreview.co.uk/2024/03/05/uk-gov-calls-for-new-gas-generation-for-backup-power/
Climate Change Committee pathways show falling fossil utilisation as renewables, storage, and demand flexibility scale.
https://www.theccc.org.uk/publication/the-sixth-carbon-budget/
- Inside Dunkelflaute, Europe’s Renewable Energy Challenge – Sustainability Magazine (Jan 2025)
- Dunkelflaute: what it means and why it matters – Sunsave Energy Blog (May 2025)
Bidirection EVs contribute 5-10GW flexibility
UK government policy bans new petrol/diesel car sales from 2030. Forecasts suggest 8–11 million EVs on UK roads by then. Average EV battery size projected ~60 kWh, giving a total fleet energy capacity of 480–660 GWh (8–11m × 60 kWh).
- Not all EVs will be plugged in or available.
- Studies assume 10–20% of fleet connected and willing to participate at any given time.
- That equates to 50–100 GWh of accessible energy.
https://www.neso.energy/publications/future-energy-scenarios-fes
