
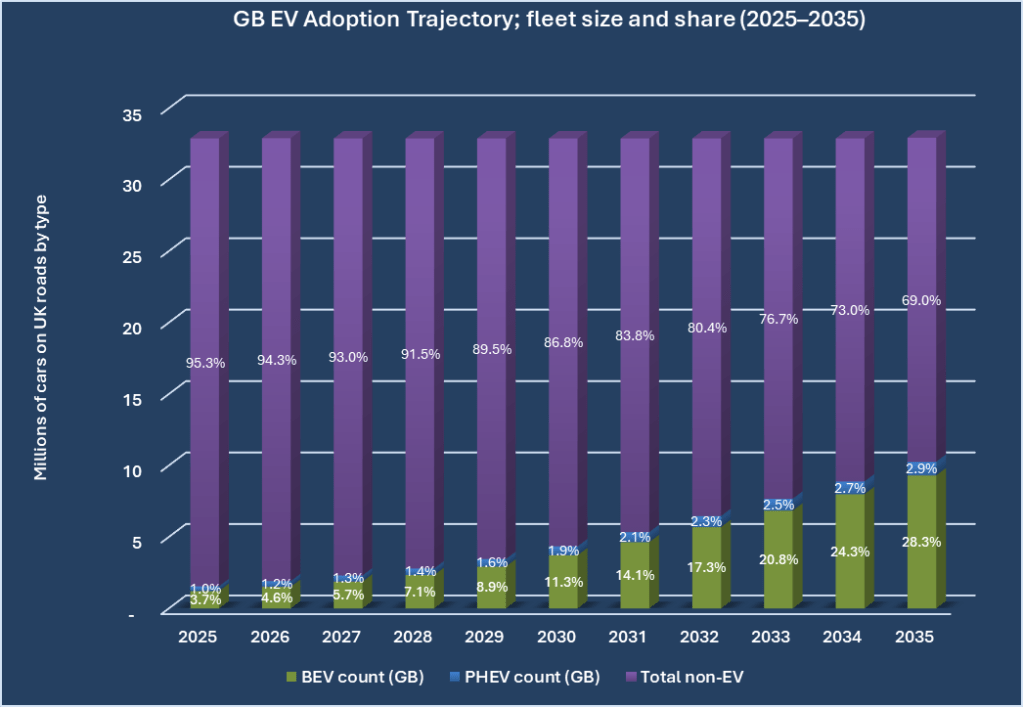
As of September 2025, there are over 1.7 million fully electric vehicles (BEVs) in the UK. By the end of 2026, this number is projected to rise to approximately 2.27 million BEVs, based on current growth forecasts. At that point over 5% of all cars in use in the UK will be fully electric.
Some people, predominantly those who know little to nothing about the grid operations and forward investments, national policy and grid scale electrical engineering, fret that all these EVs will be more than the grid can handle (conveniently overlooking impacts of things like AI data centres and other equally impactful loads).
EVs are part of the solution, not the problem.
However, with almost all new EVs being equipped with bidirectional charging capability and the complementary bidirectional home and commercial chargers abut to reach the UK market. EVs are part of the solution, not the problem.
Financial and operational value of 1 GWh EV flexibility
If 1 million of these EVs used bidirectional chargers as part of a vehicle to grid (V2G) scheme to provide just 1 kWh each that would provide 1 GWh of ‘dispatchable’ electricity to the grid. It would use just 2% of a typical EV battery, or about 4 miles of their range. It might, of course, be few cars, such as 200,000 providing 10kWh each (about 40 miles) and the numbers come out the same.
That 1 GWh is operationally highly valuable and financially meaningful to the national grid operator, NESO; its full impact would depend on timing and duration, but the flexibility it provides shouldn’t be underestimated. It could be used to lower peak demand, reduces reliance on expensive gas peaker plants (which are the major driver of electricity prices), and defers network upgrades. V2G should be one of the core pillars in Ofgem and NESO’s pathway to cheaper, cleaner power.
- Peak reduction: 1 GWh delivered in 1 hour is a 1 GW peak cut. In congested evening peaks, that scale can materially change dispatch, curbing the need for fast-ramping gas peakers and lowering marginal prices.
- Frequency and balancing: Distributed EVs can deliver sub-minute response. While 1 GWh is energy, the underlying distributed power can support hundreds of MW of fast frequency response, stabilising the system and reducing balancing costs at critical moments.
- Network deferral: Flexibility reduces or shifts loads locally, delaying or downsizing reinforcement projects. Ofgem frames consumer-led flexibility as a route to significant system savings by avoiding both generation and network build.
Financial impact
What might this mean in money terms?
Wholesale and balancing value (near-term):
- Peak-time value per MWh: Often £100–£300 / MWh during periods of strong demand or low renewables availability; during stress events, prices can spike even higher. At £150/MWh, that 1 GWh is worth ~£150,000 to NESO; at £300/MWh it rises to ~£300,000 for a single hour of peak support. It might be over £1million avoided cost during high scarcity events.
- Operational savings: Curtailing peaker usage lowers fuel, start-up, and wear-and-tear costs and reduces balancing mechanism uplift. NESO is actively seeking demand-side flexibility as integral to affordability under net zero pathways. In other words, NESO wants us consumers to use less when they ask, or sell them more.
- Owners of EVs contributing to this would expect to be paid 10 – 20 pence for their kilowatt hour of electricity; their EV potentially becomes a useful source of income.
System-wide savings (long-term)
- Macro savings from flexibility: Ofgem estimates flexibility could deliver £30–70 billion in savings by 2050 by using the system more efficiently and reducing the need for new generation and network build; EV flexibility is a prime asset in this portfolio.
- Consumer bills: Those savings flow through wholesale, network, and capacity mechanisms, lowering average bills. Policy aim is durable bill reductions as clean power scales and flexibility markets mature.
Are these big numbers?
Millions of pounds and Gigawatts of electricity certainly sound like a lot, but we should ground ourselves in what they mean in real world terms.
Peaker plant avoidance
Typical open-cycle gas turbine (OCGT) peaker units in the UK are mostly in the 200–300 MW range.
Delivering 1 GW for an hour is roughly equivalent to avoiding the operation of about 3–5 peaker units for that hour, depending on unit size and system conditions. Over multiple peak hours across a season, repeated EV flexibility events can offset substantial peaker runtime and, at scale, defer the need to build additional peaker capacity.
Impact on consumer prices and standing charges
- Energy prices: By shaving peaks and reducing reliance on high-cost peakers, EV flexibility lowers marginal wholesale prices during the hours that drive a large share of annual costs. NESO and DESNZ’s Clean Power 2030 framing puts demand flexibility at the heart of affordability under net zero, improving utilization of low-cost renewables and cutting exposure to volatile fossil prices.
- Standing charge: Standing charges reflect fixed network and policy costs. Flexibility that defers or avoids reinforcement reduces long-run network cost growth, creating scope for regulatory reductions in allowed revenues and, in turn, standing charges. Ofgem’s flexibility market reforms explicitly target system efficiency gains that reduce bills for all consumers over time.
Conclusion
Near-term: 1 GWh at the right hour is worth some hundreds of thousands of pounds and avoids several peaker units firing for that hour; repeated events across peak weeks materially cut balancing costs. These would materially reduce annual electricity bills.
Medium-term: Scaled EV flexibility (e.g., 5–10 GWh on critical evenings) becomes a structural substitute for peakers and large batteries in many scenarios, improving renewable utilization and dampening price spikes. As the number and proportion of EVs in use increases that flexible resource increases too.
Long-term: Regulated savings from avoided build and smarter operation feed through to lower average bills and standing charges as Ofgem’s flexibility market integration matures.
Sources:
- SMMT New Car Market Report – September 2025: https://www.smmt.co.uk/category/news-registration-figures/
- “Q1 2025 Automotive Industry Demand Forecast” – Advanced Propulsion Centre (APC): https://www.apcuk.co.uk/knowledge-base/resource/q1-2025-automotive-industry-demand-forecast/
- “Sector‑Wide UK Battery Demand Projections to 2035” – UKRI Faraday Battery Challenge (April 2025): https://www.ukri.org/wp-content/uploads/2025/04/UKRI-250425-SectorWideUKBatteryDemandProjectionsTo2035Report.pdf
- “Forecast EV Sales UK 2025 & 2026, Heading towards 28% BEV Marketshare” – EVBoosters (Feb 2025): https://evboosters.com/ev-charging-news/forecast-ev-sales-uk-2025-2026-heading-towards-28-bev-marketshare/
- “Vehicle Licensing Statistics, Great Britain: April to June 2025” – Department for Transport / DVLA: https://www.gov.uk/government/statistics/vehicle-licensing-statistics-april-to-june-2025
