“There’s nowhere to charge” is a common cry from the antiEV malcontents and, more sadly, those they seek to subvert. It’s one of the items of FUD on the playbook of misinformation. There’s an excellent article, Mapping, understanding and reducing belief in misinformation about electric vehicles, recently published in the peer reviewed journal Nature Energy on this topic. ”Conspiracy mentality emerged as the strongest predictor of such beliefs” was a key finding. It’s well worth a read.
But is the claim that UK charging infrastructure is inadequate true?
Looking at the latest data from ZapMap (who actively track charge points) and the Office for National Statistics, (via the Department of Transport official statistics) who report much the same, it’s easy to see what the high level truth is.
Office for National Statistics
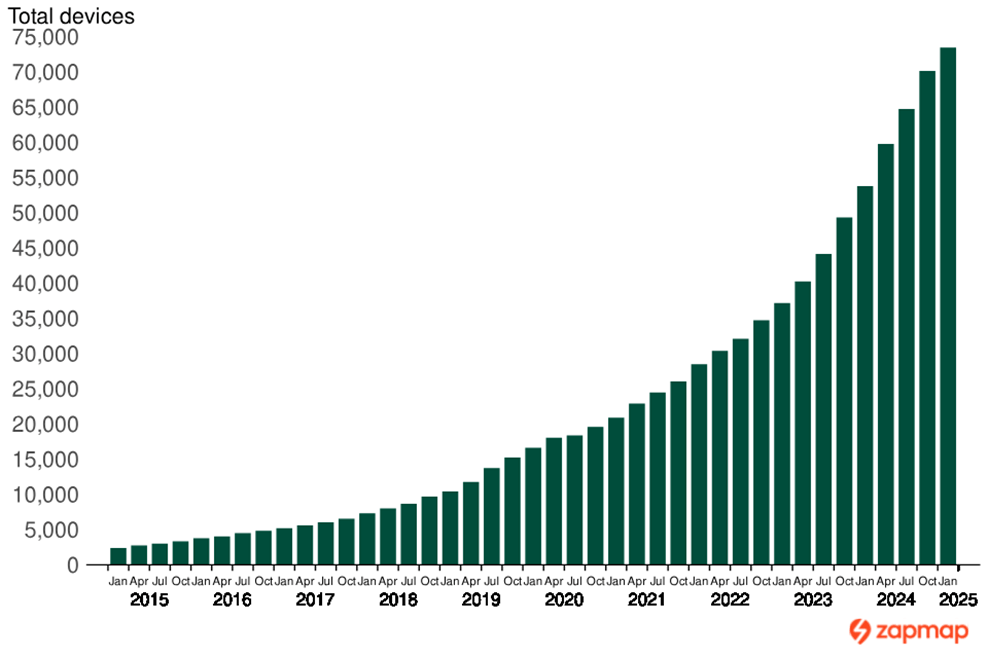
Office for National Statistics (ONS) reported that as of 1 January 2025, there were 73,334 public electric vehicle charging devices and that compared to January 2024 the total installed devices increased by 19,657, an increase of 37%.
- the number of charging devices in urban areas increased by 35% (14,021)
- the number of charging devices in rural areas increased by 45% (2,974)
There are over 100,000 EV charger connectors in the UK
However, we contacted the ONS some months ago for clarity about what a charging device really means and they confirmed that they count the physical charger and advised that each of these has, on average, 1.5 charging sockets. That pushes the number of chargers to over 100,000.
The bar chart below shows consistent and accelerating growth in total public charging devices since January 2015, with a classic ‘J’ curve typical of new technology adoption.
ZapMap
ZapMap, the UK’s leading charge point mapping and data service, publishes their data more frequently. They report connectors as well as devices in their regular EV Charging statistics update.
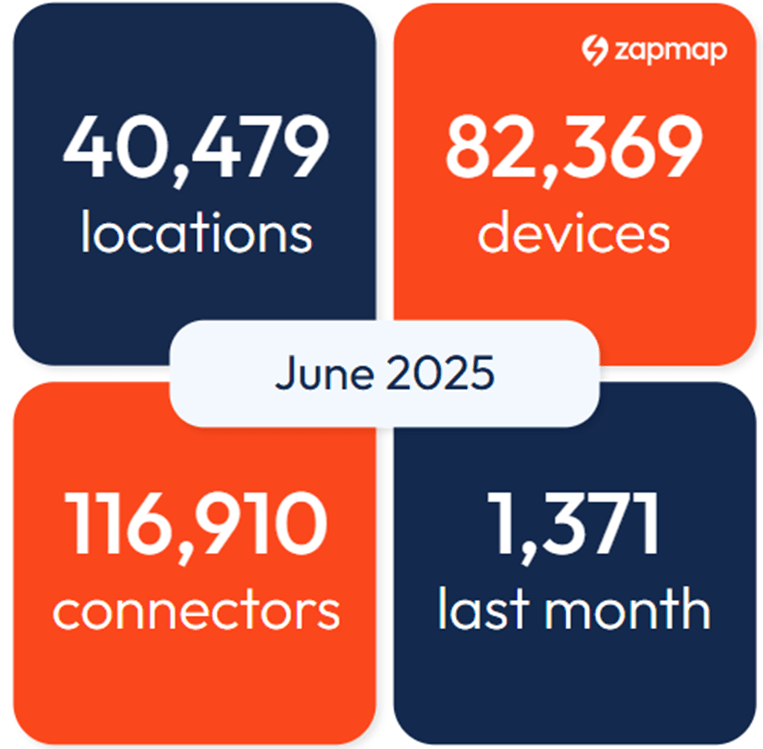
According to this at the end of June 2025, there were 82,369 electric vehicle charging points, across 40,479 charging locations (673 of these are charging hubs), and 116,910 connectors. That’s an increase of 9,035 so far this year.
This is all in addition to more than one million charge points installed at home or work where the majority of charging still takes place.
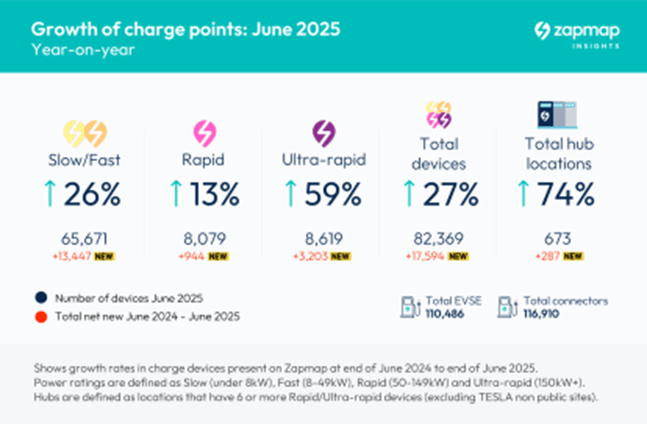
ZapMap also issued a half year report on the 3rd July 2025 with statistics on public charge point installations throughout the first six months of 2025. It shows that UK EV charge points are up 27% year-on-year, with 8,670 new ones in the first 6 months of 2025 (noting the slight discrepancy between the two reports due to the reporting methodology). It seems like there are lot of chargers and really a lot of connectors.
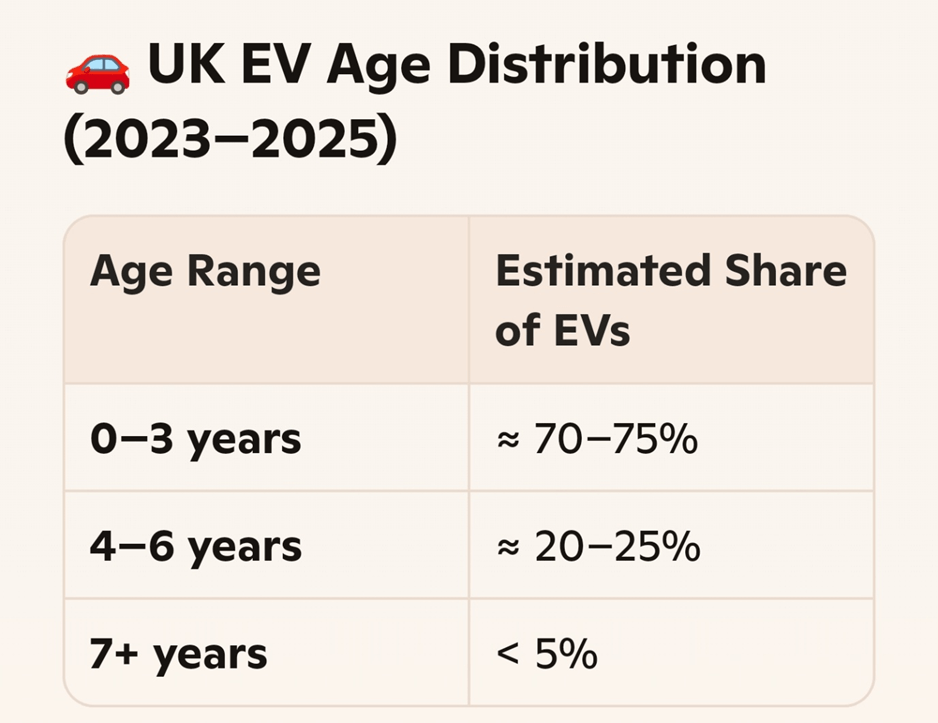
This is pretty rapid growth and is consistent with the rapid uptake of EVs in the last 7 years
Is 116,910 a big number?
According to all the information sources, there are a lot of chargers already operational in the UK. But is it really that many to support real-world use. The better measure might be to look at the number of chargers per EV and compare that with petrol and diesel pumps.
Firstly, there are about 1.4 times as many chargers as petrol pumps. Obviously, there are more a lot more ICE cars since EVs haven’t been around very long (almost all have been sold in the last 7 years). At the end of June 2025 there were over 1.5 million fully electric cars on UK roads. That’s around 4.6% of the 34 million UK cars.
There are 30 times more chargers per EV than pumps per ICE
If we use those numbers, the ratios of cars to their charger/pump are:
🟢 1 charger per 13 EVs
🟠 1 pump per 400 cars
So there are far more cars per pump than per charger, thirty times more.
“But EVs take so long to charge that the chargers are always full”
It is true that EVs are slower to recharge than legacy cars. Let us make some assumptions to calculate what this means for charger vs pump availability (the chance finding a free charger or pump when you need one). Assuming:
- 25 minutes for a 20% to 80% EV recharge on an Ultra-Rapid charger (https://www.nimblefins.co.uk/electric-car-charge-time-calculator )
- 8 minutes to top up a petrol car (often longer)
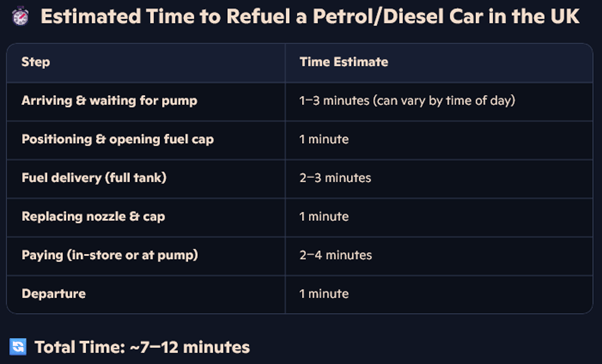
EVs therefore take maybe 4 times longer to refuel than legacy cars. Note that the time on-pump for petrol and diesel is only about 6 minutes, as another car is using the pump during arrival and departure.
Although there are a huge number of EV chargers not all are the super-fast type used on long distance travel. According to the ZapMap data there are 8619 Ultra-Rapids, rated at 150kW or higher.
To nail down whether you are more likley to have to wait for a charger or a pump we need to make yet more assumptions about how often each type of car needs to ‘fill up.’
Internal Combustion Engine (ICE) Cars
- Average UK mileage: ~616 miles/month
- Average fuel economy: ~40 mpg (≈8.8 miles/litre)
- Tank size: ~50 litres
- Range per tank: ~440 miles
Refuels per month: ~1.4 times/month.
Battery Electric Vehicles (EVs)
- Average EV efficiency: ~3.5 miles/kWh
- Monthly mileage: ~616 miles
- Energy needed: ~176 kWh/month.
Ultra-Rapid Charging Use:
- Most EV drivers charge at home or work (~75–80% of sessions)
- Ultra-rapid charging is typically used for: Long trips, emergency top-ups, drivers without home charging
Average ultra-rapid sessions: 1–2 times/month (less if home charging is available; more for fleet/taxi use)
Let’s call it 1.4 times per month in both cases. Also let’s think mostly about the 3 hours around the morning and evening rush hour (and ignoring weekends) when there is the the greatest potential delays getting the energy needed. That is 120 hours of rush hour each month.
With 1 Ultra-Rapid charger for every 17.5 EVs wanting to charge up 1.4 times per month the total use per charger is:
1.4 charges x 17.5 EVs x 25 minutes = 10.2 hours per month,
8.5% of peak charger demand period
With 1 petrol pump per 400 legacy fuel cars, also wanting to fill up 1.4 times per month, the notional amount of time they are in use is:
1.4 refuels x 400 EVs x 6 minutes = 56 hours per month,
46% of the peak pump demand period.
| EV | ICE | |
|---|---|---|
| Chance of charger/pump being occupied during peak periods | 8.5% | 46% |
| Likely wait time (mid-point of charge duration) | 12.5 minutes | 3 minutes |
| Impact metric (chance occupied x lost time) | 1.06 | 1.38 |
On that basis you are somewhat more likely to lose time waiting for a petrol pump during peak periods than waiting for an EV charger.
You are more likely to lose time waiting for a petrol pump during peak periods than waiting for an EV charger.
Despite the apparent complexity, this is a much-simplified model, and you are free to challenge the assumptions. Note that no account has been made for the use of 33,000 workplace chargers, 1 million home chargers (9,200 of these are available to the public) or 10,000 kerbside chargers. This could further decrease the demand for chargers (and is also why the economic model for charger companies is challenging)
Conclusion
It is true that there are places where the infrastructure is ‘thin’, in the same way as mobile phone coverage can be patchy. But claims that the charging infrastructure for EVs is inadequate is a very peculiar way of looking at the actual data. In fact, there are rather more chargers per electric car that petrol station pumps per ICE car. That number is set to swell with another 100,000 in the pipeline, backed by a £63 million government scheme.
Although charge time is markedly longer for the current generation of EVs than the time to fill a legacy vehicle, typically taking place while the driver uses the facilities, the chance of being delayed while waiting for a charger is less and the Impact metric suggests about a 30% lower inconvenience factor.
Also see the article on off street parking challenges:
