Public debate about solar farms often centres on a single fear: “they’re taking away farmland we need for food.”
It’s an understandable concern; food security matters, and land is finite. But when you look at the actual data, a very different picture emerges.
Solar farms use far less land than people imagine, they use very little prime agricultural land, and they produce orders of magnitude more energy per hectare than biofuel crops. Meanwhile, other land uses, including golf, quietly occupy far more space with no contribution to energy or food.
To ground (pun intended) the conversation, we should begin by understanding how much farmland there is. According to Corine Land Cover data, farmland land covers ~56% of the UK, of which ~70,000 km2 is pasture used for grazing cows and sheep, and around 67,000 km2 is for growing cereals and legumes.
How much land do solar farms actually use?
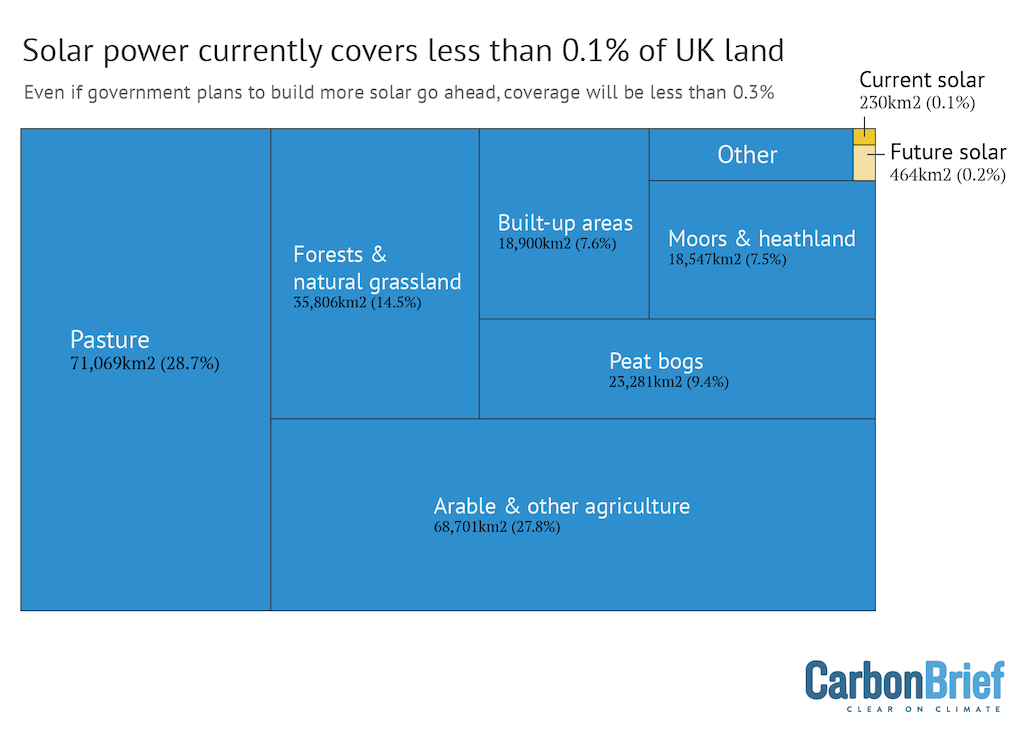
The UK’s ground‑mounted solar farms occupy around 21,200 hectares of land (UK Government, DESNZ estimate).
To put that into context:
- The UK has 17.6 million hectares of land.
- Solar farms therefore use about 0.12% of the UK’s land area.
If UK land were a football pitch, solar farms would cover an area the size of the tiny centre circle.
How much of that land is prime farmland?
People repeatedly claim solar farms replace high quality farmland, without looking at the grades of land actually used.
The data says most solar is on low value land, which would not be especially productive for food:
The only detailed grade‑by‑grade mapping of solar farms comes from CPRE’s analysis of 38 large operational sites. They found:
| Grade | Meaning | Area used |
|---|---|---|
| Grade 1 | Excellent | 45 ha |
| Grade 2 | Very good | 216 ha |
| Grade 3a | Good (BMV) | 566 ha |
| Grade 3b | Moderate | 755 ha |
| Total mapped | — | 2,582 ha |
Prime land (Grades 1 & 2): 261 ha (~10%)
Grade 1 (the very best land): just 45 ha (~2%)
Most solar farms are on Grade 3b, which is not Best and Most Versatile (BMV) land.
Solar Energy UK’s industry‑wide dataset reinforces this:
– Only 37.6% of solar farms include any BMV land
– And on those sites, only 20% of the area is BMV
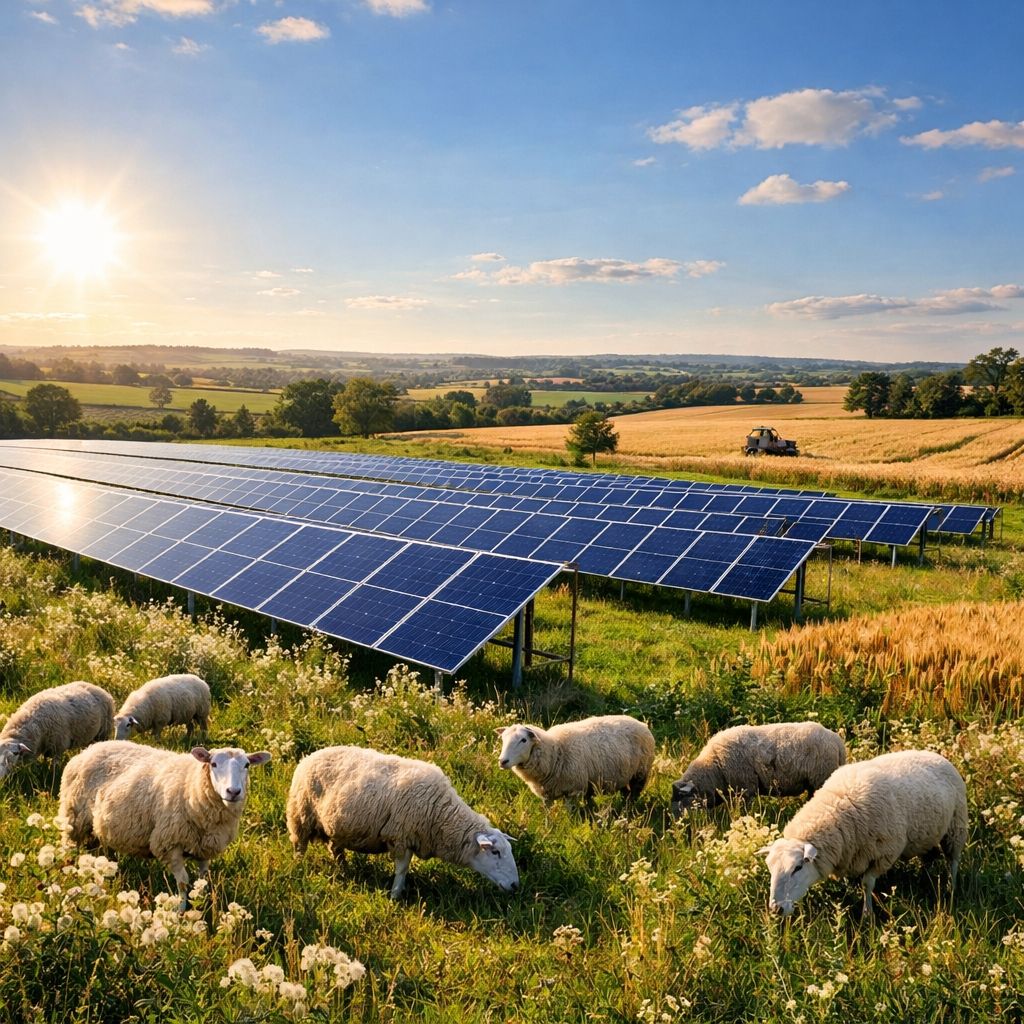
It’s also important to note that about 50% of land assigned to solar is also used for agricultural and grazing at the same time. Adding solar panels to grassland while still grazing sheep is a “win-win”.
Half the solar farm land is also used for agricultural and grazing
“It’s not ‘produce 10 units of energy’ or ‘produce 10 units of food’. It could be six units of both. And then, all of a sudden, your two halves are greater than the whole.”
Meanwhile, DEFRA the Department for Environment, Food and Rural Affairs, has clearly stated that climate change, not solar power, is the “biggest medium- to long-term risk” to the nation’s domestic food supply. Research suggests that climate change could decrease the proportion of BMV (best and most versatile) arable farmland from 38% to 11% by 2050.
It’s also worth observing that agricultural land generally relies on extensive use of chemicals and farming machinery, impacting native species. In contrast, solar farms improve biodiversity.
Solar farms improve biodiversity
Solar farms just don’t meaningfully compete with food production. Climate change does.
But… “Two-thirds of mega solar farms built on productive farmland”
You may have seen recent headlines claiming that “59 percent of England’s largest solar farms are built on productive farmland” and that almost a third occupy “best and most versatile” (BMV) land. At first glance this seems to contradict the figures earlier in this article, which show that only a small proportion of solar‑farm land is actually high‑grade agricultural soil. The difference comes down to the way the numbers are framed.
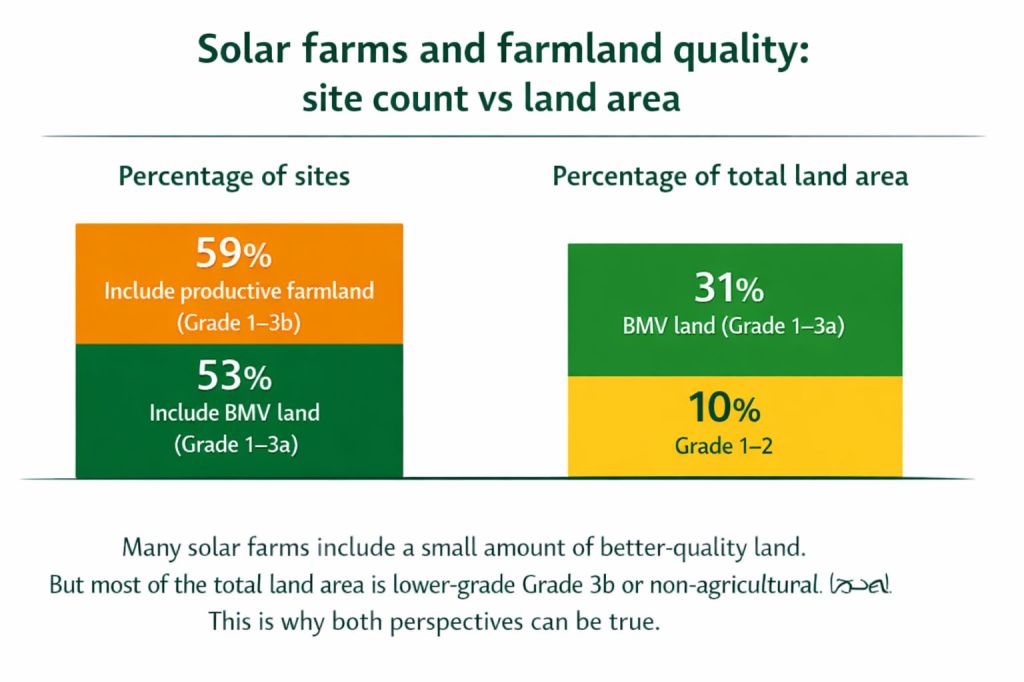
The CPRE analysis counts how many sites include any amount of productive land. It treats a solar farm with 5 hectares of Grade 3a in one corner the same as a solar farm built entirely on Grade 1. This produces a high percentage of sites that touch BMV land, even if the area involved is small.
The analysis in this article looks at land area, not site count. When you total the mapped hectares across the same 38 large solar farms, only about 10 percent of the land is Grade 1 or 2, and about 31 percent is Grade 1 to 3a. The majority of the land area is lower‑grade Grade 3b or non‑agricultural land. In other words, many sites include a sliver of better land, but most of the actual land used is not prime farmland.
Both statements are true. They simply answer different questions.
- CPRE: “How many sites include any productive land at all?”
- This article: “How much of the total land area is actually high‑grade farmland?”
Understanding the difference between counting sites and measuring land area helps explain why the headlines can sound dramatic while the underlying data still shows that solar farms use very little of England’s best agricultural soil.
What about biofuel crops?
Biofuel and bioenergy crops occupy 133,000 hectares of UK farmland (UK Government, Bioenergy Crops dataset); over six times more land than solar farms.
Unlike solar, biofuel crops must be grown on high‑quality arable land, typically Grades 1–3a, because yields collapse on poorer soils. Biofuel crops actively displace food crops.
So if the concern is “food vs energy”, biofuels are the real land‑use competitor, not solar.
Food security
Perhaps we shouldn’t measure this in terms of land area. A better measure could be the impact of turning solar farms or biofuel crops over to food production.
The UK imports 40-50% of its food, so there is an argument that we should do this to improve food security.
Reverting solar to food
DEFRA data shows only 7,000 ha of agricultural land has solar panels, and half of that remains in agricultural use (mostly grazing).
So the land actually displaced from food production is ~3,500 ha.
But crucially, most of this is Grade 3b, not prime land.
If converted to wheat, this land could feed ~0.1 million people. That’s just ~0.2% of UK food needs.
Because solar rarely occupies prime land, switching it back to food crops would have negligible impact on UK food imports or food security.
And unlike biofuels, solar farms can support sheep grazing, improve biodiversity, restore soil structure, and remain fully reversible at end-of-life, with the soil having had time to recover.
Reverting biofuel crops to food crops
Bioenergy crops occupy 133,000 ha; almost all of it prime arable land.
If converted to wheat, this land could feed ~4 million people. That’s ~6% of UK food needs. It’s also 40 times the impact of changing solar farms back.
Because biofuel crops occupy the UK’s best farmland, switching them back to food crops would have a real, measurable impact on food security and import dependence.
Energy per hectare: the decisive factor
The data is pretty clear in this. Solar farms produce more energy per hectare than biofuels. It would be a better use of land , especially BMV farmland, to use 10-20% of it for solar instead of biofuels and revert the remainder to food production if food is the priority. However, farmers are forced to make their own economic decisions for their businesses, and not all biofuel fields are suitable for connecting to the grid.
Solar delivers 10–40 times more useful energy per hectare than biofuel crops.
| Land use | Typical energy output |
|---|---|
| Solar PV | 0.8–1.2 GWh/ha·year |
| Biofuel crops (wheat ethanol) | ~20 MWh/ha·year |
| Biofuel crops (maize biogas) | 50–80 MWh/ha·year |
Anyone for golf?
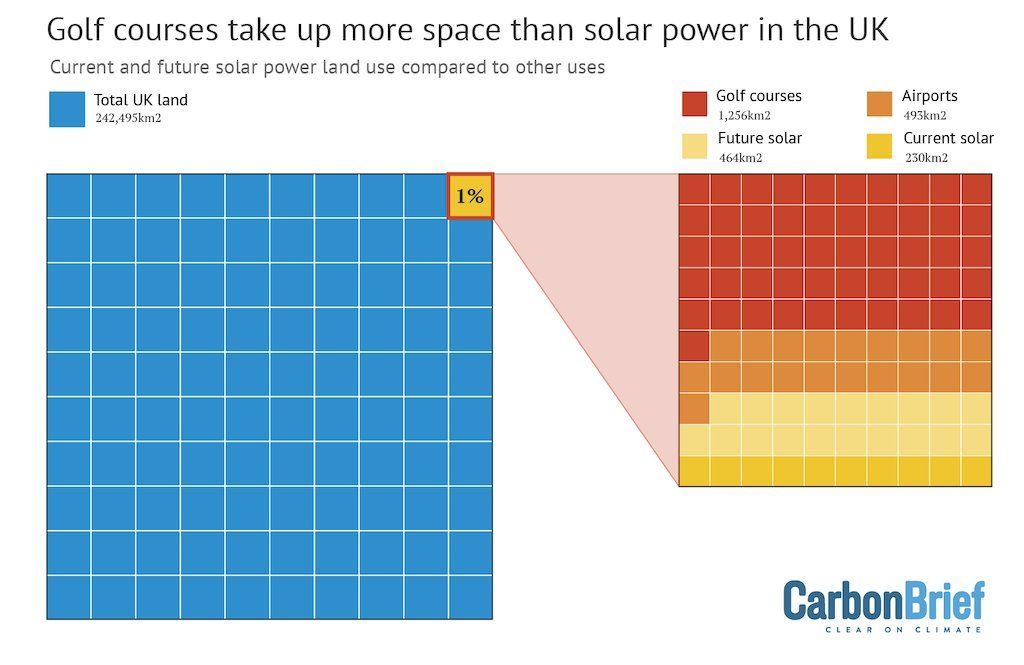
Golf courses in Great Britain occupy ~118,000 hectares of land (Ordnance Survey, UK golf industry data); five to six times the land used by solar farms.
However, while the area of golf courses is impressively large, they are rarely on agricultural land. The golf course comparison, interesting though it is, is largely irrelevant to the debate.
Are solar farms a threat to agriculture?
The answer appears to be a robust No.
- They use very little land overall.
- They use a shrinkingly small amount of prime farmland.
- They produce far more energy per hectare than any crop.
- They can coexist with grazing and biodiversity.
- They are fully reversible.
- They reduce reliance on fossil fuels and imported energy.
If the UK wants to maximise energy security while minimising land impact, solar is one of the most efficient tools available.
It’s also important to note that the decision to install solar is mostly by the farmers themselves. As shows like Clarkson’s Farm have shown, farmers struggle to earn enough from food crops to maintain viable businesses. They have been encouraged to diversify and partnering with investors to install solar farms is one of the ways they can ensure their farmlands do not have to be sold off to housing developers.
While most people would prefer to see fields of golden rippling corn instead of the scientific marvels that are modern solar panels, the reality is that they are a climate change necessity, an economic lifeline and have no meaningful impact on the nation’s food security whilst having an increasingly potent impact on energy security whilst preserving land for future generations. They also improve biodiversity compared with farmland.
References
- Department for Energy Security and Net Zero (DESNZ). Land Use Estimate for Ground‑Mounted Solar PV. https://www.gov.uk/government/statistics/land-utilised-by-solar-p
- CPRE. Solar Farms: Agricultural Land Classification Analysis of 38 Large Sites. https://www.cpre.org.uk/news/two-thirds-of-mega-solar-farms-built-on-productive-farmland/
- UK Government. Bioenergy Crops in the UK: 2008–2023. https://www.gov.uk/government/statistics/crops-grown-for-bioenergy-in-the-uk
- Ordnance Survey & UK Golf Industry Reports. Land Area of Golf Courses in Great Britain. https://www.ordnancesurvey.co.uk/business-government/products/open-greenspace
- Natural England. Agricultural Land Classification (ALC) Technical Guidance.
- BEIS & National Grid ESO. UK Solar Capacity Factors and Performance Data.
- CarbonBrief. Factcheck: Is solar power a ‘threat’ to UK farmland? https://www.carbonbrief.org/factcheck-is-solar-power-a-threat-to-uk-farmland/
- Defra. Food Security Report 2021: Theme 2: UK Food Supply Sources https://www.gov.uk/government/statistics/united-kingdom-food-security-report-2021/united-kingdom-food-security-report-2021-theme-2-uk-food-supply-sources#united-kingdom-food-security-report-2021-theme2-case_study-2-1
- Campaign to Protect Rural England (CPRE) Two-thirds of mega solar farms built on productive farmland https://www.cpre.org.uk/news/two-thirds-of-mega-solar-farms-built-on-productive-farmland/
