We often hear complaints about solar farms using up important farm land, while other major uses of such land are ignored. A classic case is golf courses; many people are surprised to learn how much (usually prime) land is given over to this (pleasant, but not as essential as generating energy for our nations) hobby. People might also assume golf courses are environmentally friendly and some express ‘concern’ about the embedded carbon in solar and wind systems. Let’s put this into perspective.
Are golf courses better for the planet than solar or wind farms?
The comparison isn’t even close.
Golf courses have a large, ongoing environmental footprint, while wind turbines have a small, one‑off manufacturing footprint that is paid back in clean energy within about 1–2 years.
Below is the breakdown…
🟢 1. Golf Courses: Large, Continuous Environmental Impact
Land Use
| Land use | Estimated area (hectares) |
|---|---|
| Golf courses (England only) | 270,000 ha |
| Solar farms (UK) | 21,200 ha |
| Onshore wind (UK, envelope) | ~168,000 ha* |
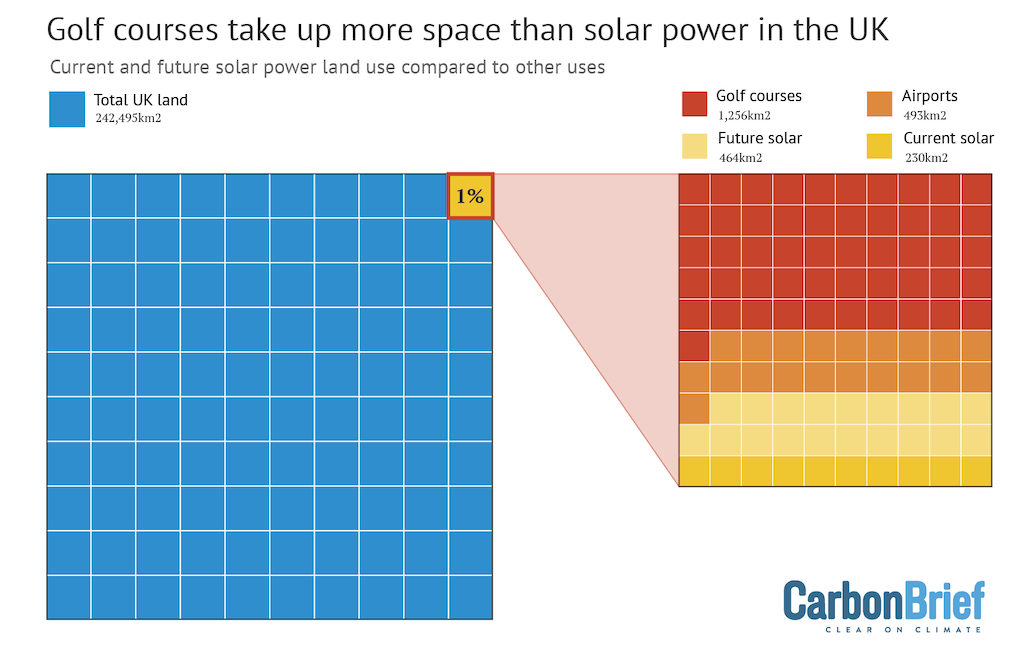
- The UK dedicates 0.49% of all land to golf courses — more land than all solar + wind installations combined.
- Globally there are 38,400 courses, many in ecologically sensitive areas.
Golf courses use around 15 times more land than solar farms.
Resource Use
Golf courses require:
- Millions of litres of water per year for irrigation.
- Continuous fertiliser, pesticide, and herbicide use, causing runoff and pollution.
- Regular mowing and maintenance, which emits CO₂.
Carbon Balance
The R&A’s own research shows:
- Golf courses emit CO₂ from maintenance, buildings, machinery, and chemical use.
- Turfgrass sequesters some carbon, but not enough to offset emissions; the balance is still net‑positive emissions.
Golf courses also expand every year, increasing their footprint.
🟢 2. Wind Turbines and Solar Panels: Small, One‑Off Manufacturing Footprint
Lifecycle Emissions – Wind
According to the IPCC and 2025 LCA studies:
- Onshore wind: 7–11 g CO₂e/kWh
- Offshore wind: 8–14 g CO₂e/kWh
This is 98% lower than fossil fuels.
Lifecycle Emissions – Solar
- Mono‑Si panels (UK average): 20–40 g CO₂e/kWh, depending on manufacturing origin and installation location.
- Thin‑film panels (e.g. CdTe): As low as 14–20 g CO₂e/kWh.
This is ~90–95% lower than fossil fuels, though slightly higher than wind.
Manufacturing Footprint – Wind
- Around 91–92% of a turbine’s lifetime emissions come from manufacturing steel, concrete, and composites.
- Transport + installation add only a few grams CO₂e/kWh.
Manufacturing Footprint – Solar
- ~80–90% of lifecycle emissions come from manufacturing:
- Silicon purification
- Wafer slicing
- Cell and module assembly
- Frame and glass production
- Emissions vary by country:
- Panels made in China (coal-heavy grid) have higher embodied carbon.
- Panels made in France or Germany (low-carbon grid) have much lower footprint.
- Adds only a few grams CO₂e/kWh, similar to wind
Carbon Payback Time
- A wind turbine repays its entire manufacturing carbon footprint in ~1–2 years of operation. After that, it produces near‑zero‑carbon electricity for 20–30 years.
- Solar panels replay their embedded carbon in 1–4 years, depending on panel type, origin, and solar irradiance. After that, panels generate near-zero-carbon electricity for 25–30 years.
🟢 3. The Land Use Comparison
If just 25–75% of golf course land in the top golfing nations were used for renewables, it could generate:
- 281–842 GW of solar, or
- 174–659 GW of wind power
That’s more clean energy than many countries currently produce.
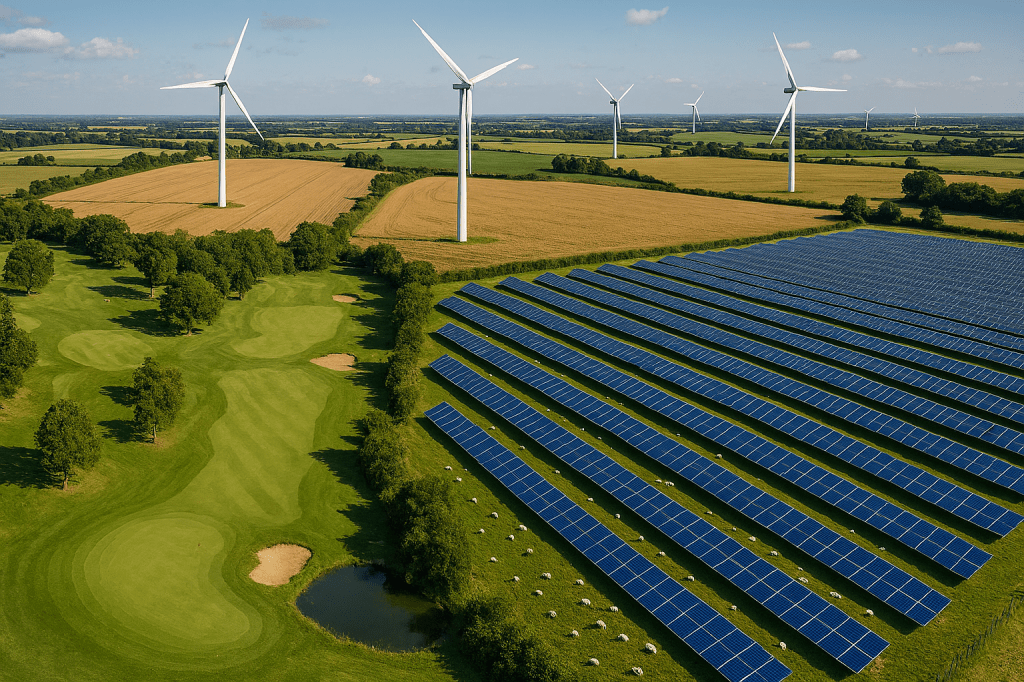
Wind turbines also require very little ground area; the land around them can still be used for farming or recreation.
🟩 Bottom Line:
Golf courses have a large, ongoing carbon and environmental footprint — water use, chemicals, mowing, land clearing — and they occupy more land than all renewable energy installations in countries like the UK. 13 – 15 times more.
Wind turbines have a one‑off manufacturing footprint that is paid back in 1–2 years, after which they generate near‑zero‑carbon electricity for decades.
So the carbon footprint of golf courses is far higher and continuous, while the footprint of turbine manufacturing is small, one‑off, and rapidly offset.
This is definitely worth a read:
And this makes interesting food for thought
