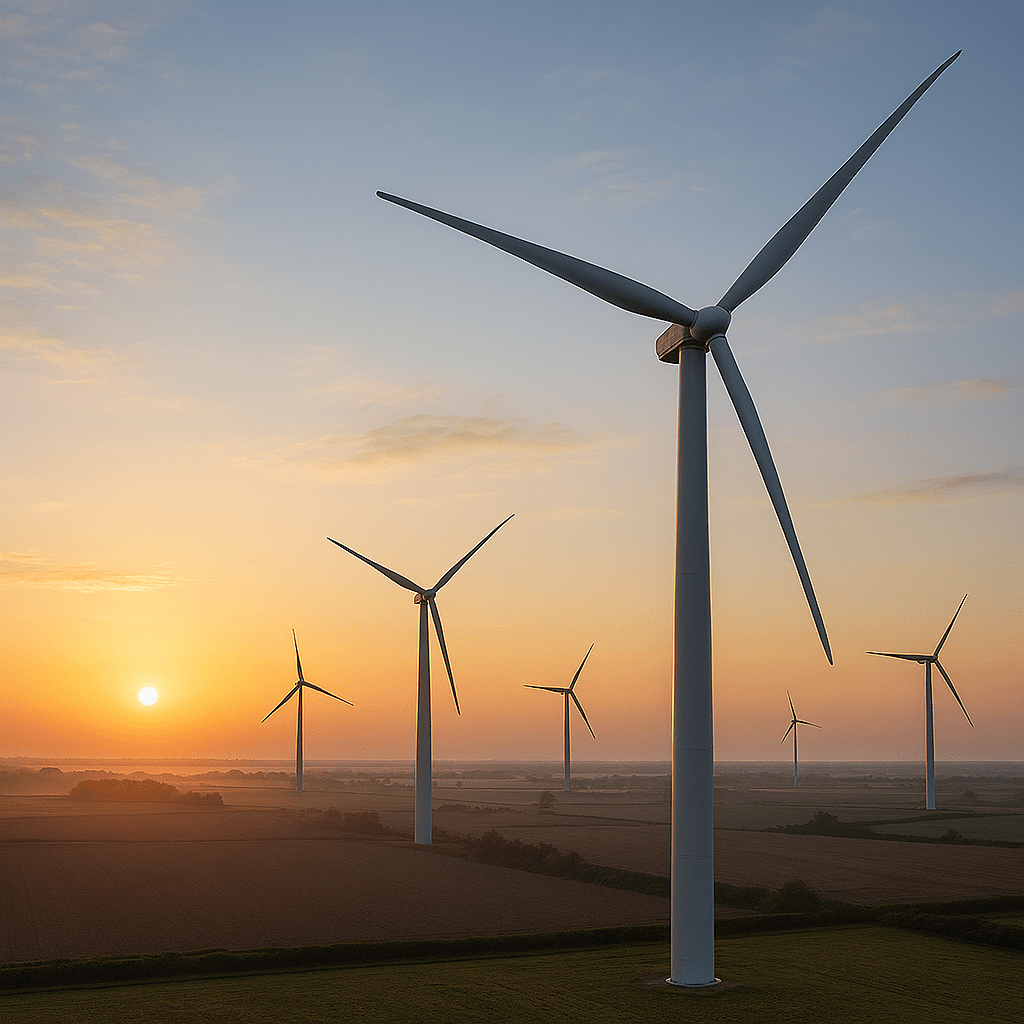
Wind turbines have become emblematic of the global transition to clean energy. Yet debates persist about their true environmental footprint. Critics and active FUDwits often claim that turbines require enormous amounts of concrete, steel, and energy to build, implying that they may take decades to “pay back” their carbon debt. Supporters counter that turbines are among the cleanest technologies ever deployed and produce some of the lowest cost energy available.
Life‑cycle assessments (LCAs) provide the most rigorous way to quantify the embedded carbon, energy payback, maintenance impacts, and lifetime performance of wind turbines. Recent empirical studies give us a clear picture of how modern onshore turbines perform over their full life cycle.
This article considers the current evidence to answer four key questions:
- How much carbon and energy are embedded in a modern wind turbine?
- How quickly does it repay its carbon and energy “debt”?
- What are the ongoing maintenance costs and associated emissions?
- Over its operational life, how much energy does it produce and how much carbon does it offset?
Understanding the Anatomy of a Modern Wind Turbine
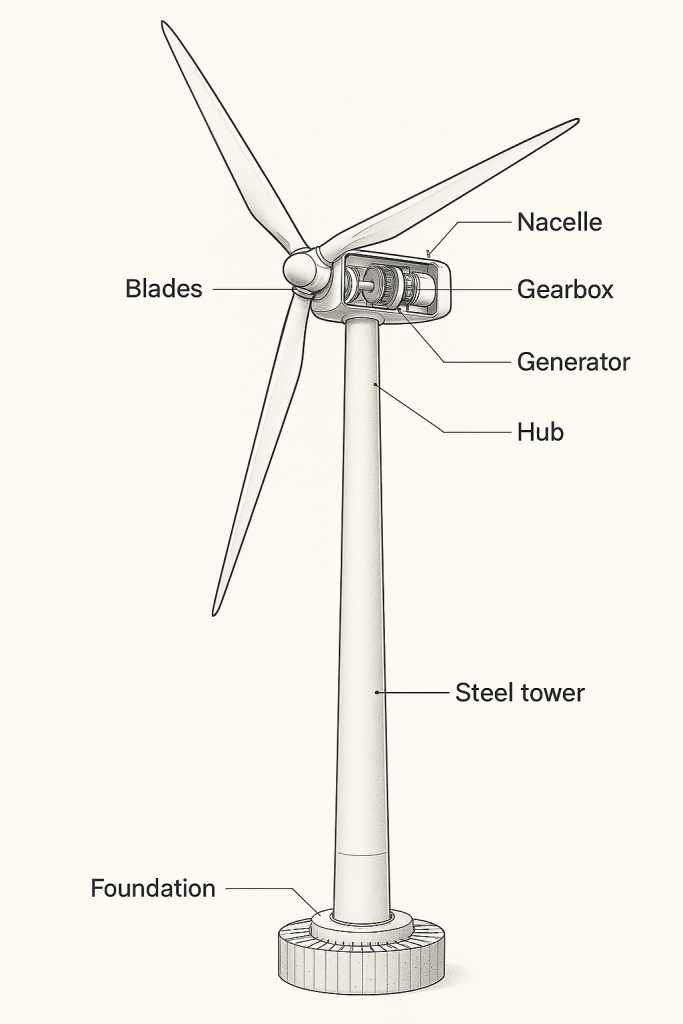
A modern onshore wind turbine in the 3–3.5 MW class typically includes:
Foundation
1,000–1,500 tonnes of reinforced concrete, with rebar steel embedded throughout. This is the largest single contributor to mass, but not to carbon intensity per kg
Tower
200–300 tonnes of rolled steel, fabricated in sections, transported by road
Nacelle
- Steel frame
- Gearbox (if not direct‑drive)
- Generator
- Power electronics
- Copper wiring
- Hydraulic and cooling systems
Blades
At 40–60 metres long, with fibreglass, epoxy resin, balsa or foam cores, they have high embodied energy per kg, but low total mass. There have been concerns about the ability to recycle these, however this is now being addressed, further lowering their environmental impact.
Cabling, transformers, and balance‑of‑plant
- Copper and aluminium, control systems, access roads and grid connection
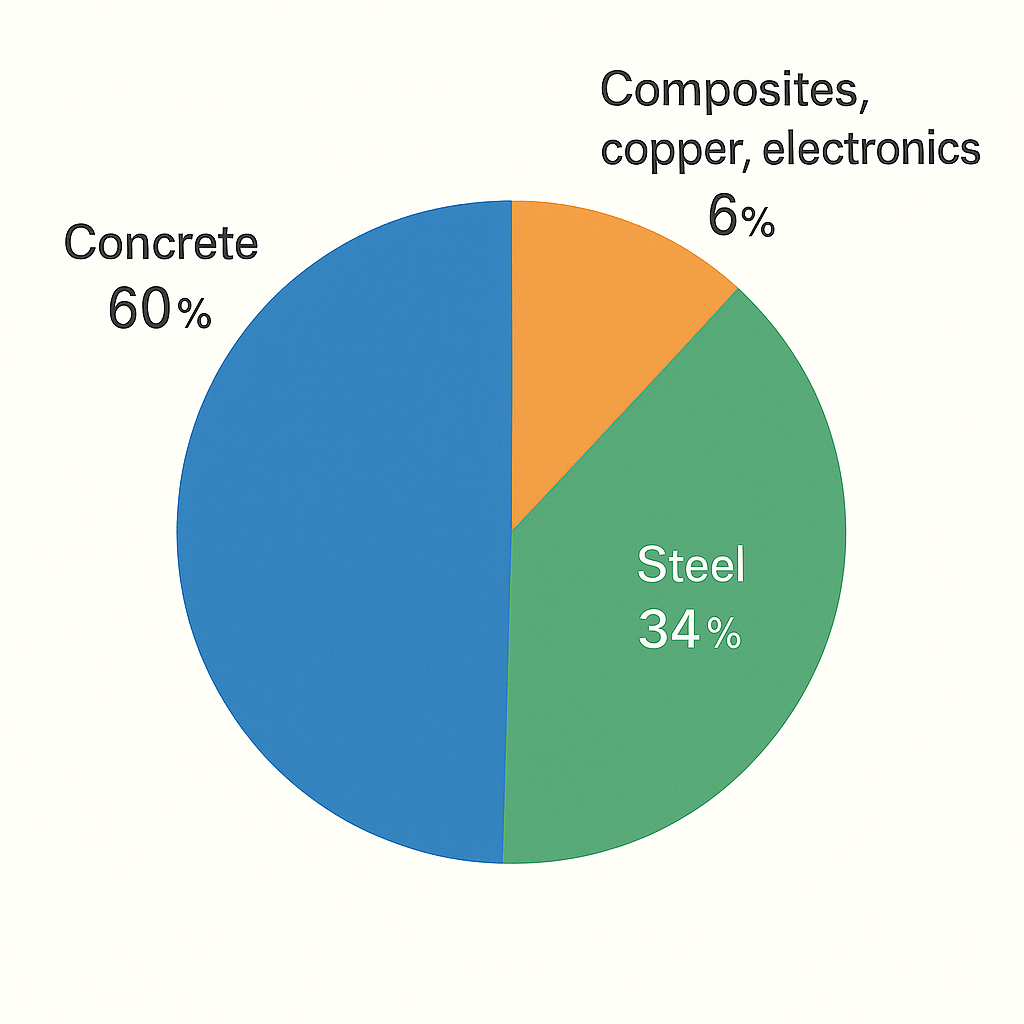
A detailed LCA of a 15 MW onshore wind farm (five 3 MW turbines) found the material composition to be approximately:
- 60% concrete
- 34% iron/steel
- 6% other materials
This breakdown is typical of modern onshore installations.
Embedded Carbon and Energy: What It Takes to Build a Turbine
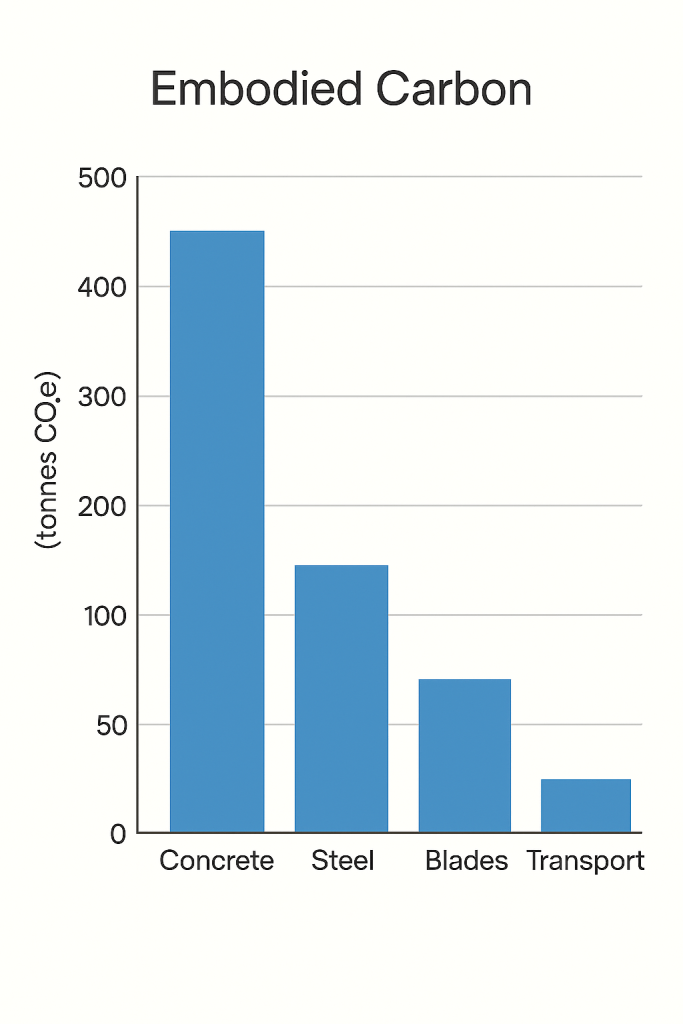
Embodied Carbon
For a single ~3 MW onshore turbine, cradle‑to‑site embodied greenhouse gas (GHG) emissions are dominated by:
- Concrete foundation: large mass, relatively low carbon intensity per kg, but big total.
- Steel (tower, rebar, nacelle frame): high mass and moderate–high carbon intensity.
- Fiberglass/epoxy (blades) and copper (wiring): smaller mass but higher intensity per kg.
- Transport and installation: non‑trivial but much smaller than materials.
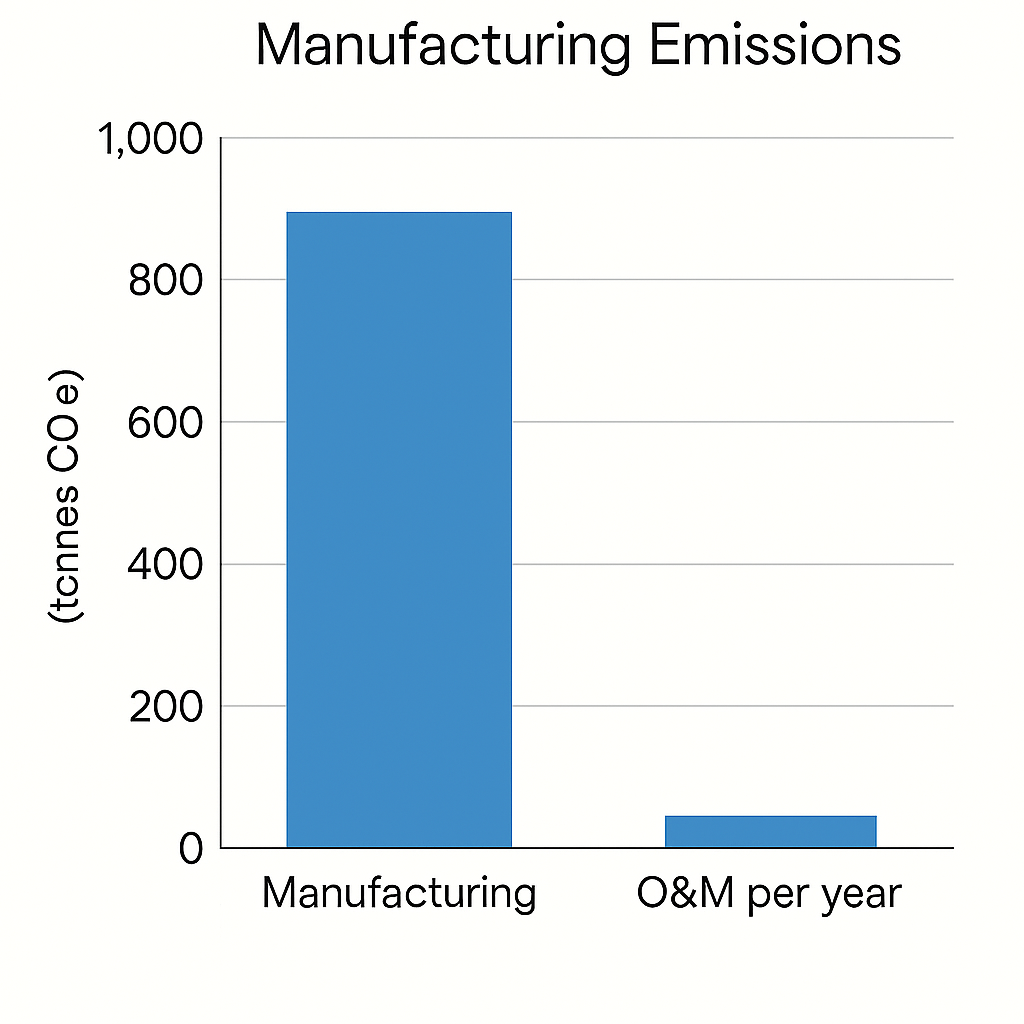
A detailed study of 14 turbines (50 kW–3.4 MW) found that a 3 MW‑class turbine embodied about 1000 tonnes CO2e (including manufacture, transport, and installation).
Across multiple LCAs, a modern mid-sized 3 MW onshore turbine has ~1,000 tonnes of CO₂‑equivalent (tCO₂e) embodied in manufacturing, transport, and installation. This includes:
- Steel production (high carbon intensity)
- Concrete production (lower intensity but huge volume)
- Composite blade manufacturing
- Transport to site
- Crane operations and installation
Embodied Energy
A recent empirical LCA of a 15 MW onshore wind farm (5 × 3 MW turbines) found:
- Energy Payback Time (EPBT): 6.1 months
- GHG Payback Time: 7.8 months
This means the turbine produces more energy than was used to build it in just over half a year. Claims that it takes years for wind turbines to replay their energy debt are unfounded.
A turbine produces more energy than was used to build it in just over half a year
Larger Turbines Are More Carbon‑Efficient
A study of 14 turbines from 50 kW to 3.4 MW found that larger turbines have higher absolute embodied carbon, but Much lower embodied carbon per kWh. For a 3.4 MW turbine, embodied emissions were only 0.9% of lifetime emissions; this is because bigger turbines capture more energy per unit of material.
Carbon Payback Time: How Fast Does a Turbine Repay Its “Debt”?
To calculate carbon payback, we combine Annual energy output, Grid carbon intensity displaced and Embodied carbon
Annual Energy Output
For a 3 MW turbine at a 35% capacity factor:
Avoided Emissions
Assuming displacement of a moderately fossil‑intensive grid (~0.4 tCO₂/MWh):
Carbon Payback
This aligns well the GHG payback time of 7.8 months from the LCA study we previously cited.
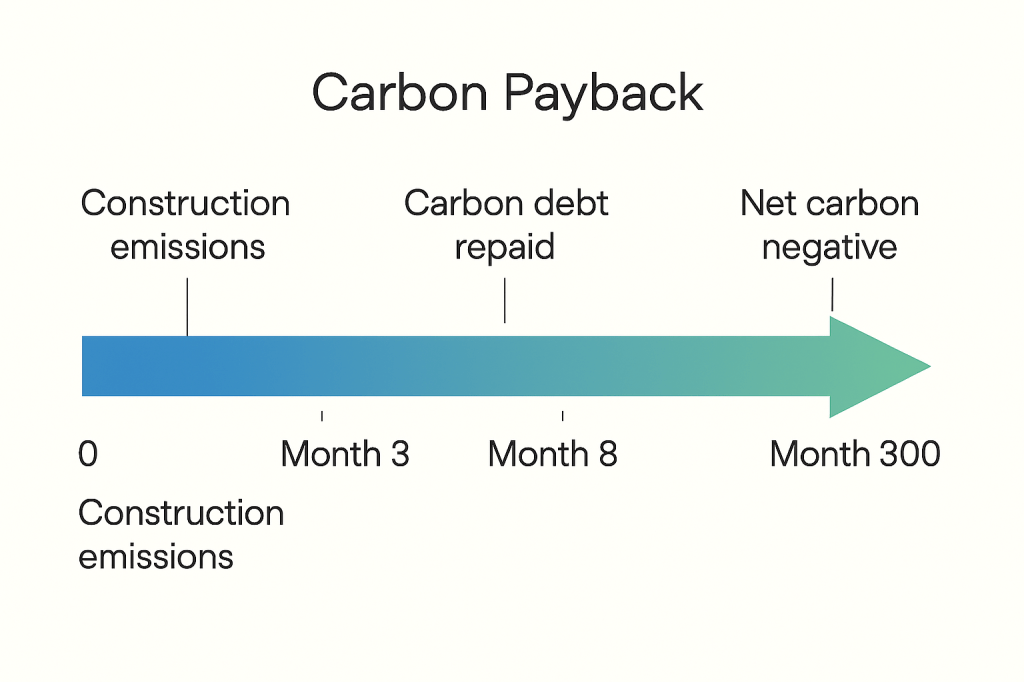
A modern onshore turbine typically repays its carbon debt in 3–8 months, depending on wind resource and grid mix. After that, it operates in net carbon benefit for the remaining 20–25+ years.
Maintenance: Costs, Emissions, and Real‑World Impacts
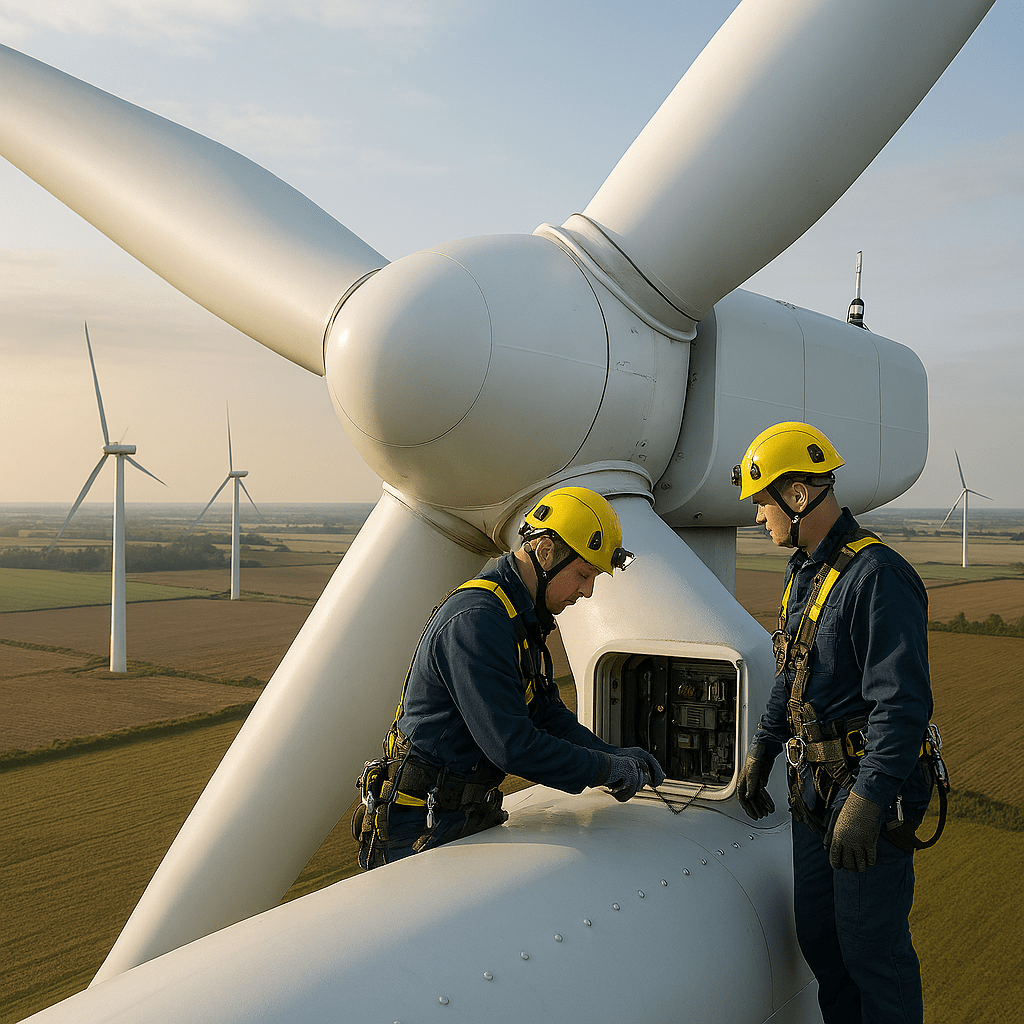
The primary maintenance types required are:
- Routine inspections (1–2 per year)
- Lubrication and consumables
- Corrective maintenance (gearbox, generator, electronics)
- Occasional major replacements
- Blade repairs
Typical onshore O&M costs are €10–25 per MWh (including land lease, insurance, and maintenance). Maintenance alone is a subset of this. LCAs to asses the Carbon Cost of maintenance consistently show:
- Manufacturing dominates life‑cycle emissions
- Maintenance contributes only a small fraction (<10–20%)
This is because maintenance emissions come mainly from service vehicle fuel, replacement part manufacture, lubricants and oils. Again the study cited above explicitly includes O&M and still finds extremely low life‑cycle emissions.
Operational Life: How Long Do Turbines Really Last?
Design Life
Older turbines have operational lifetimes forecast at 20 years, whilst current generation turbines are 25–30 years. Realistically, most modern turbines can operate for 20–25+ years without major life‑extension and 30+ years with refurbishment.
Fatigue, obsolescence, and economics usually determine end‑of‑life more than mechanical failure.
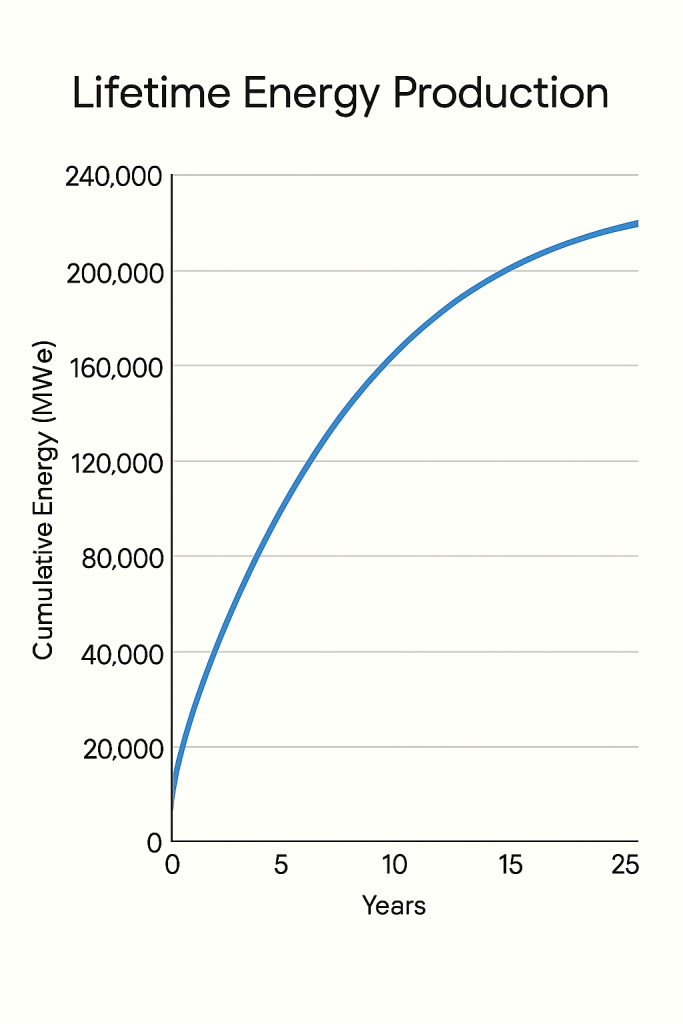
Lifetime Energy Production and Total Carbon Offset
Using the earlier annual output we can calculate the lifetime energy output:
Even accounting for degradation, 200 –230 GWh is a typical lifetime output per turbine. It’s a lot!
Meanwhile, assuming 0.4 tCO₂/MWh displacement, we calculate the lifetime carbon avoidance as:
To get the net carbon we subtract the Life‑Cycle Emissions (Embodied ~1,000 tCO₂, O&M of a few hundred tCO₂)
Total life‑cycle emissions: ~3,450 tCO₂ (using ~15 gCO₂/kWh typical LCA value)
That’s 88 thousand tonnes of avoided greenhouse gases per turbine! Prosaically, a single modern turbine offsets tens of thousands of tonnes of CO₂ over its life, far more than required to build, transport, install, operate, and maintain it.
What about offshore turbines?
While modern 3 MW onshore turbines offer exceptional carbon efficiency, larger offshore turbines, often exceeding 12 MW, present a different profile. Offshore turbines benefit from stronger, more consistent wind speeds, yielding higher capacity factors (often 45–55%), which improves lifetime energy output. However, their embodied carbon is significantly higher, due to massive steel monopiles, subsea cabling, specialized vessels, and complex installation logistics.
Offshore LCAs show carbon payback times of 6–12 months, slightly longer than onshore, but still well within the first year of operation. The trade-off is clear: offshore turbines deliver more energy per unit, but require greater up-front investment in materials, emissions, and ecological disruption, especially to marine ecosystems. For coastal nations with limited land, offshore wind remains indispensable, but from a pure carbon-efficiency standpoint, onshore turbines are a somewhat leaner, faster-repaying option.
Offshore LCAs show carbon payback times of 6–12 months, slightly longer than onshore
The Big Picture: What the Evidence Really Shows
Across dozens of independent life-cycle assessments, the carbon and energy performance of modern 3 MW onshore wind turbines is remarkably consistent. Each unit typically embodies around 1,000 tonnes of CO₂ during manufacture and installation, yet repays this carbon debt within 3 to 8 months of operation. The time it takes to generate the energy used in its own construction, the energy payback period, averages just 6 months. With minimal ongoing maintenance emissions and an operational life of 20 to 25+ years, these turbines deliver 200-230 gigawatt-hours of clean electricity over their lifetime. The result is a net carbon benefit of over 88,000 tonnes of CO₂ avoided, making them one of the fastest and most effective decarbonisation technologies available today.
Final Verdict
Wind turbines do not take decades to repay their carbon debt. They repay it within the first year, then operate for two decades or more as major net reducers of greenhouse gas emissions.
The data is clear:
Modern wind turbines are among the most carbon‑efficient energy technologies ever deployed.
