In our previous post we looked at whether the suggestion that we should use public transport, especially to lower carbon emissions, instead of driving holds true. This leads to us considering other alternatives.
We are all encouraged to walk or cycle more. There is no doubt that more people should walk, and do it a lot more; it’s good in so many ways. But are CO₂ emissions one of them, and how does walking compare with cycling or, historically, riding a horse?
Obviously walking everywhere isn’t practical; distances are often too great, it takes too long and carrying capacity is limited. Nevertheless it’s useful to put the emissions into perspective.
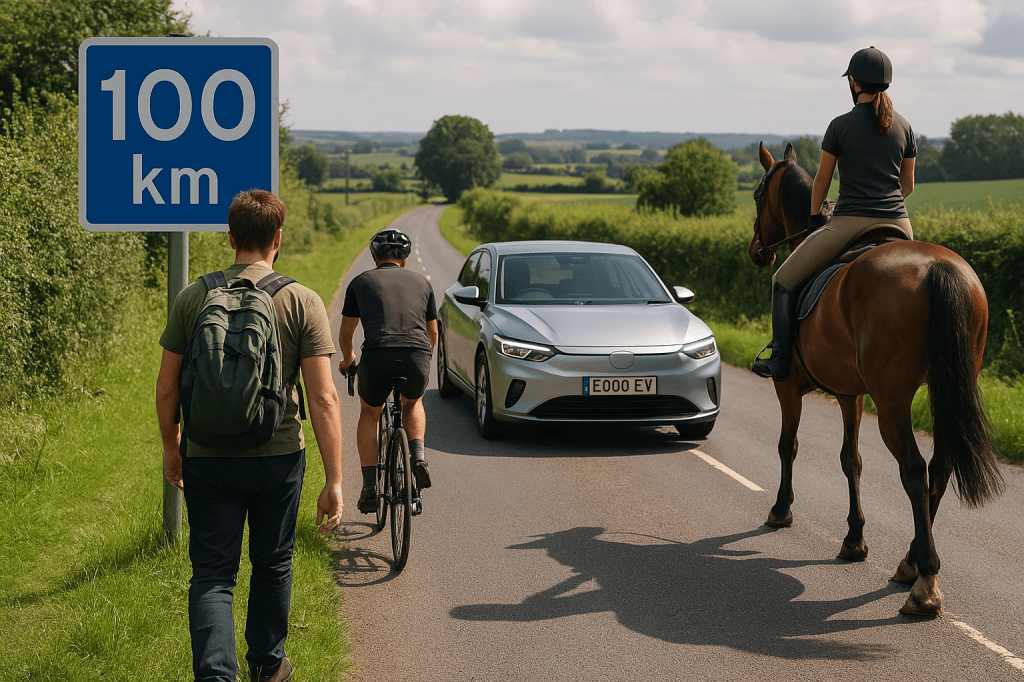
For this article we will roughly compare the emissions in CO₂e (carbon dioxide equivalent) from different modes of travel based on a 100 km (62 mile) journey. Keep in mind that each number depends on many assumptions, the estimates are therefore approximate, but interesting and fun to think about nevertheless.
Electric Vehicle (EV)

- Vehicle embedded carbon:
At the outset we should accept that it’s not just about the energy emissions; we should include aspects such as battery and vehicle production, often referred to as ’embedded carbon’. Using very pessimistic vehicle lifecycle assumptions that an electric car remains in use for just 160,000 km (100,000 miles) and that battery recycling is only 90% at that point (current batteries are expected to remain in use for 250,000 to 400,00 miles and then be 95%+ recycled): - CO₂ emissions:
An EV might consume about 15 kWh per 100 km. With electricity carbon intensity of roughly 200 g CO₂e per kWh (UK national average 2), then the direct (operational) emissions come out to around 3 kg CO₂e/100 km 3.- 15 kWh/100 km × 200 g CO₂e/kWh = 3,000 g CO₂e/100 km
- However it’s likely that most EV drivers choose to source electricity from renewable/non-carbon sources, which have a carbon intensity as low as 50 g CO₂e per kWh or even lower, giving direct (operational) emissions around 0.75 kg CO₂e/100 km.
- 15 kWh/100 km × 50 g CO₂e/kWh = 750 g CO₂e/100 km (or about 0.75 kg CO₂e/100 km)
- Total emissions are therefore 8.25 kg CO₂e/100 km.
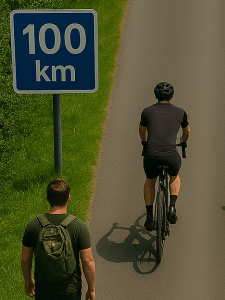
Human-Powered Travel (Walking & Cycling)
Extra calories equal extra emissions:
Although we often think of walking or cycling as “zero emission,” you do need extra food to fuel the extra physical activity. A study 1 in Nature (one of the most respected scientific journals) on this topic estimated the additional food intake required for walking. The emissions depend on diet, which is linked to the economic development of the nation and socioeconomic factors for individuals, simplified as follows:
Less industrialised or plant-focused diets: 0.05 kg CO₂e/km (settings where food production is very low-emission).
More developed economies where diets tend to be more carbon intensive: up to 0.26 kg CO₂e/km.
The wide range here reflects differences in average diets, how much extra is actually “needed” on a per-kilometer basis, and other local factors.
Walking
The number of calories burned while walking depends on factors like weight, speed, and terrain. However, for a typical person in the UK (around 70 kg), walking at a moderate pace (~5 km/h) burns roughly 50–70 kcal (about 60 – 80 watt hours) per km. This corresponds roughly to 5–26 kg CO₂e per 100 km. The higher figure is probably the one to use when comparing with EV use in the UK.
Cycling
Cycling is a far more energy-efficient way to travel on your own power, using only 20- 30 kcal per km; better than 50% less than walking. That comes to about 2.2 – 11 kg CO₂e per 100 km.
Riding a Horse
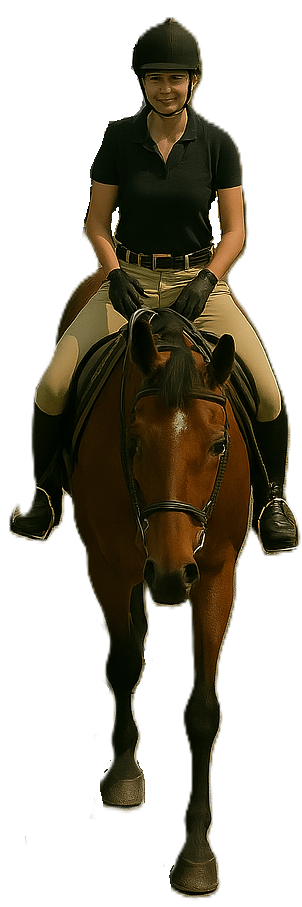
- For fun, let’s think about the first decades of the 20th century, when horses dominated the transport choices. There are relatively few published studies exist 4 for the extra greenhouse gas emissions associated with the feed and care a horse requires when used as a travel means.
- Because horses are large animals, they naturally need a lot of feed. If you try to attribute some of the carbon cost of feed production (including factors like feed type, farming practices, and even manure management) to the extra energy expended during travel, you might arrive at a number on the order of roughly 20–30 kg CO₂e per 100 km.
Summary
| Mode | Estimated Net CO₂e Emissions per 100 km | Notes |
|---|---|---|
| Electric Vehicle 🟢 | ~8.25 kg (‘green’ electricity + embedded carbon) | Depends strongly on vehicle efficiency and the actual carbon intensity of the electricity used. Most of that is the embedded carbon from manufacturing the vehicle. |
| Walking 🟡 | ~5–26 kg | Extra emissions come from needed food production; use the upper range for regions with carbon-intensive diets, like the UK. |
| Cycling 🟢 | ~2.2–11 kg | Roughly half the extra caloric cost needed for walking, so half the emissions. |
| Riding a Horse 🔴 | ~20–30 kg | Highly variable; depends on the additional feed needed and many management factors. |
| Petrol Vehicle 🔴 | ~22–25 kg | Embedded carbon is significant, but fossil fuel consumption accounts for 2/3rd of the carbon emissions |
Putting It All in Context
In the developed world it turns out that cycling and EV-use are broadly the same in carbon intensity. Walking has surprisingly high emissions for people on typical western diets, though these are the folk who should probably walk more. A century ago horses were the dominant form of long distance and industrial transport; they perform the worst of the transport options compared with today’s options, including compared with petrol cars.
Cycling and EV are broadly the same in carbon intensity
For comparison, a typical petrol car in the UK consumes ~7 litres of fuel per 100 km, emitting an average of 16.1 kg CO₂ per 100 km. Embedded carbon from manufacturing contributes a further 5–10 tonnes CO₂e over its lifetime or around 6 kg per 100km, while fuel refining and distribution add a further ~20% to this. The combined emissions for legacy car types is ~22–25 kg CO₂e per 100 km.
A final reminder that each of these comparisons rests on complex lifecycle assessments. Definitions of “net emissions” may include only operational energy or the broader set of upstream emissions (from food or fuel production).
Further Thoughts
We have only considered the carbon emission impacts of these forms of transport. While these are critically important from a climate change perspective, there are other factors to consider. Health benefits of walking and cycling have been alluded to. We also shouldn’t forget the amount of space required for different forms of transport, remembering that the space itself (and especially spaces made with concrete) have embedded carbon.

With future decarbonisation of the grid drives EV emissions even lower, or if dietary shifts (for example, moving toward low-emission, plant-based foods) lower the per-km cost of human-powered travel, these values will shift further. Factors like vehicle manufacturing, battery recycling, and even how much of the extra food calories really count as “additional” (versus replacing otherwise wasteful consumption) all play a role in these calculations.
What’s clear is that we should walk, cycle or use a renewables-powered EV in preference to petrol, diesel or even horse-based transport
These ballpark figures illustrate that a well-run EV (on clean electricity) is at least as good as the best-case human-powered options. What’s clear is that we should walk, cycle or use a renewables-powered EV in preference to petrol, diesel or even horse-based transport 🤔. That’s food for thought.
Sources
1. Fuelling walking and cycling: human powered locomotion is associated with non-negligible greenhouse gas emissions
https://www.nature.com/articles/s41598-020-66170-y.pdf
https://www.nutracheck.co.uk/calories_burned/walking/walking
2. Grid electricity carbon intensity:
https://ourworldindata.org/grapher/carbon-intensity-electricity
https://www.iea.org/reports/electricity-2025/emissions
3. EV emissions
https://energysavingtrust.org.uk/advice/how-green-are-electric-vehicles/
4. Horse emissions:
https://www.euroequestrian.eu/en/EEF-Newsroom/News/Equine-hoofprint-carbon-footprint-study-completed-by-Wageningen-University-Research-and-EEF.html
https://www.horsejournals.com/acreages-stables/management-maintenance/rethinking-environmental-impact-horses-sport
