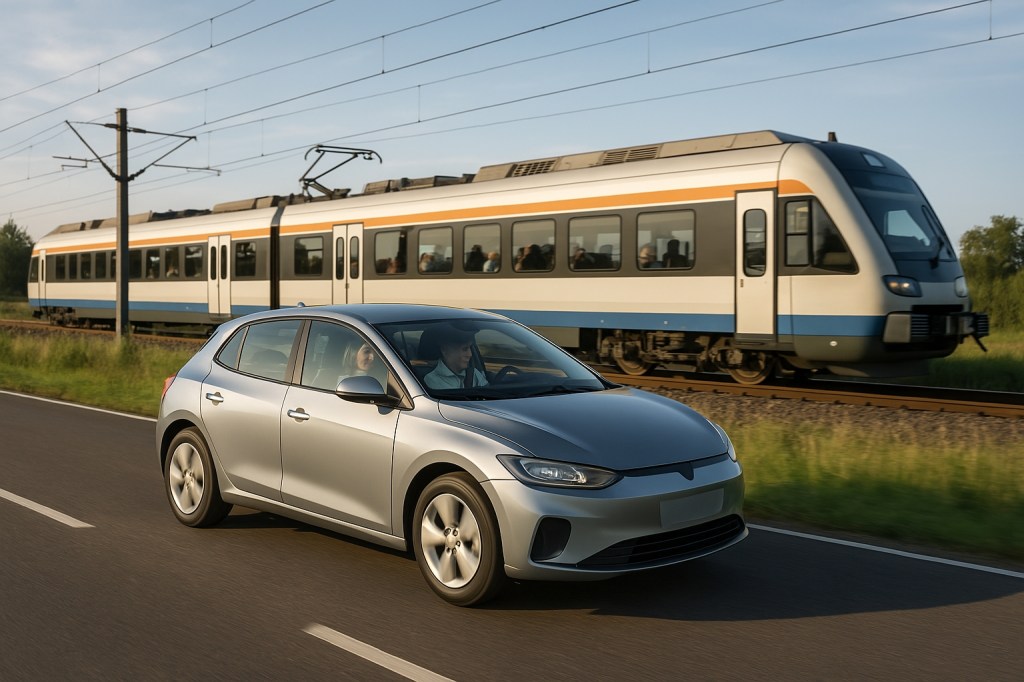
We often hear the argument that people should use public transport rather than drive. Fewer petrol and diesel cars on the roads is obviously a good thing in terms of both congestion and the toxic and climate altering emissions. However the position doesn’t allow for electric vehicles in the mix, nor for the real world occupancy rates of each form of transport.
In this article we analyse the real world costs, energy use and emissions for EV use Vs public transport.
Assumptions
- A private EV is typically driven by one person—and if it’s used by a whole family, then the fuel (electricity) cost and even the upstream energy/emissions can be thought of as divided among, say, an average occupancy of about 1.6 persons (a figure supported by UK National Travel Survey data ).
- Public transport vehicles are operated on a fixed schedule so that the “per‐passenger” energy use and emissions depend on how full the vehicle is. During peak times—when trains or buses run near capacity—the “energy and emissions toll” per passenger drops. But many services run offpeak, and the average occupancy may be well below the ideal. To reflect this reality a “high occupancy” scenario (typical of peak times) and a “low occupancy” scenario (more off-peak or underused services) are offered.
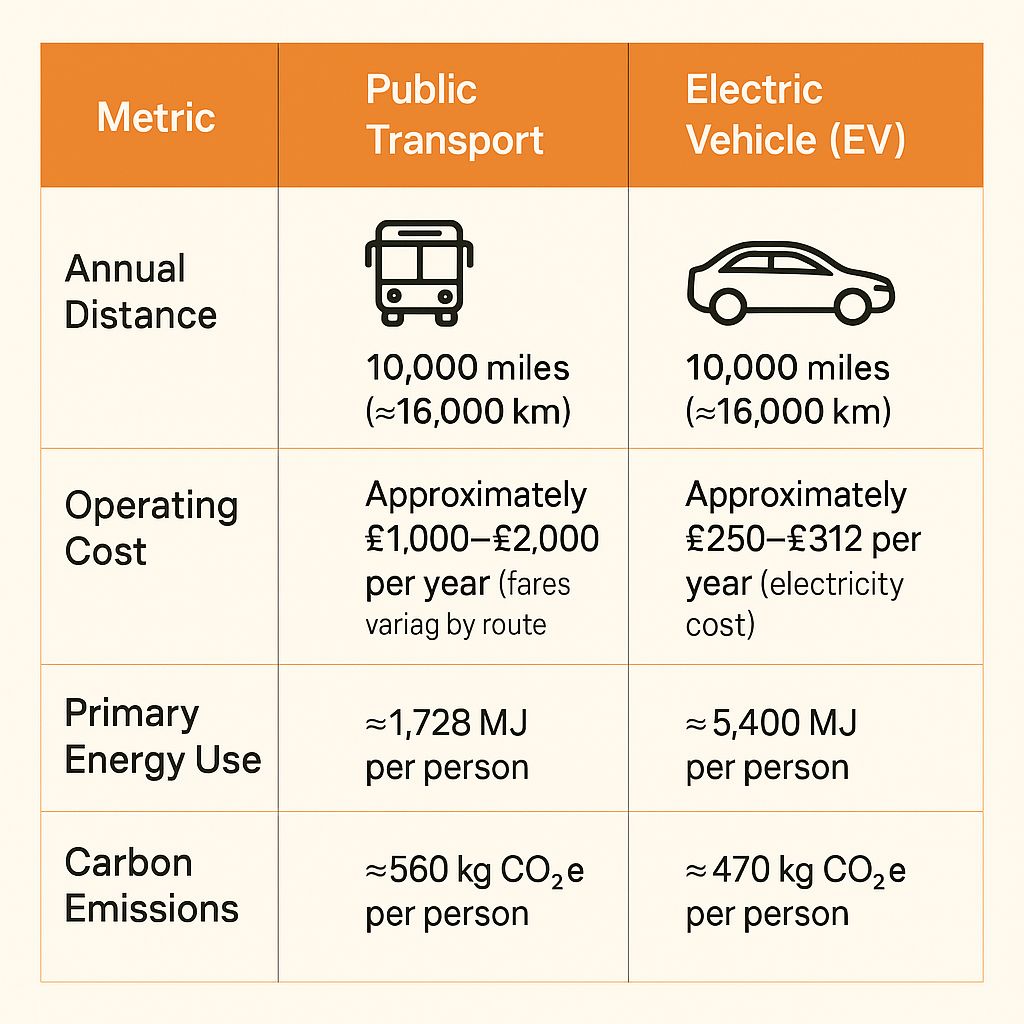
- The amount of travel people do varies widely and is almost always mixed mode, however here we are going to compare the public transport Vs EV impact based on 10,000 miles (≈16,000 km) per year as a typical amount of travel per person.
1. Operating Cost (Direct Monetary Outlay)
- Electric Vehicle (EV):
- Without Sharing: A modern EV will use around 2,400–2,500 kWh per year to cover 10,000 miles, at an electricity cost of roughly £400–£500.
- With Sharing: If that same vehicle is used by a family with an average occupancy of 1.6 people, the effective “fuel cost” per person falls to about £250–£312 per year.
- Note:
- Other costs like depreciation, insurance, and maintenance aren’t included here, but if shared, the per‐person share also drops.)
- If an overnight electricity tariff and/or self generation from domestic solar panels are used then these costs are lower still, often as little as 2p/mile, £200 for 10,000 miles.
- Public Transport:
- Fares are almost always a per‐passenger cost. For the journey in question, an annual spend might be roughly £1,000–£2,000 per person. If you can use a season pass these costs fall a bit, but only for your regular commute.
- Occupancy Impact: Even though a train or bus may run with many empty seats offpeak (and thus operate less efficiently from an energy/emissions viewpoint), the fare you pay does not change if you’re traveling alone. There’s little incentive to travel as a group—each person pays the ticket price.
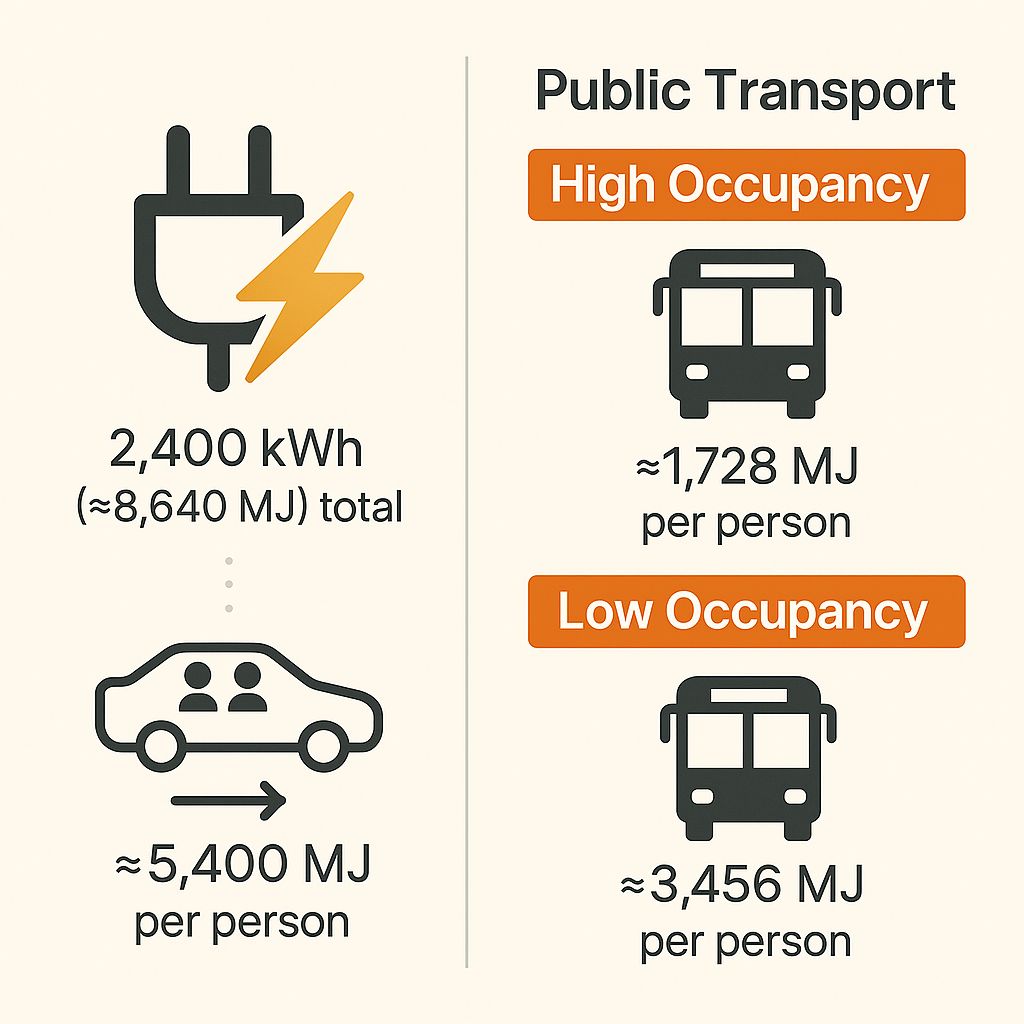
2. Primary Energy Use
The key here is to allocate the total energy used (after accounting for generation losses) among the actual passengers.
- Electric Vehicle (EV):
- An EV’s direct “on‐road” energy use might be around 4 miles per kWh. Over 10,000 miles this is roughly 2,400 kWh (about 8,640 MJ; 1 kWh ≈ 3.6 MJ).
- Shared Occupancy: With an average occupancy of 1.6, each person “accounts” for about 1500 kWh (8,640 MJ ÷ 1.6 ≈ 5,400 MJ) per year.
- Public Transport: Here the per–passenger energy depends strongly on how full the service is. Consider two scenarios:
- High Occupancy (Peak Conditions): Efficiently loaded services can be as low as about 4.8 kWh per passenger–mile. Over 10,000 mikes this equals 480 kWh (480 × 3.6 = 1,728 MJ) per passenger per year.
- Low Occupancy (Offpeak/Underused Services): If occupancy is lower, the effective energy use may be roughly doubled (around 9.6 kWh per passenger–mile): 960 kWh (3,456 MJ) per passenger.
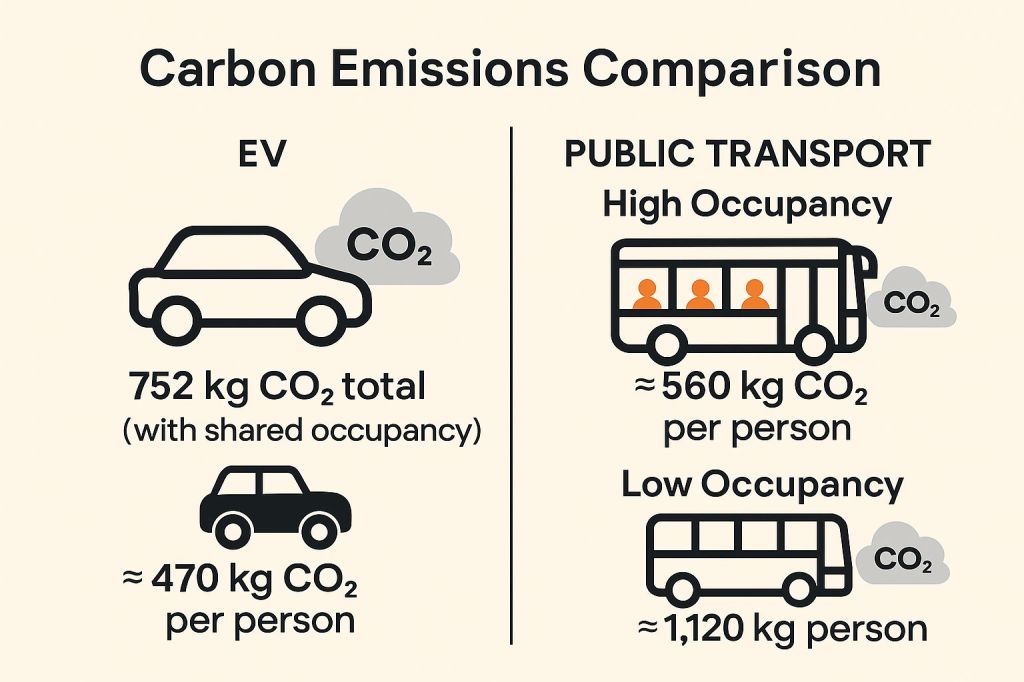
3. Carbon Emissions
Even if an EV has zero tailpipe emissions, the carbon “cost” is hidden in the electricity generation.
- Electric Vehicle (EV):
- A widely used estimate is about 47 g CO₂e per km. Over 10,000 miles, that comes to around 752 kg CO₂e.
- With Occupancy Sharing: Dividing this by 1.6 yields about 470 kg CO₂e per person.
- Green Energy Consideration: Many/most EV owners choose to buy their electricity from suppliers using 100% renewables generation, or generate their own power using their own solar panels. This significantly reduces the carbon footprint of EV usage, achieving near-zero emissions.
- Public Transport: Emission intensity is lower when a vehicle is fully loaded. Again, consider the two occupancy scenarios:
- High Occupancy: Under efficient conditions (for example, modern electric trains), you might get as low as roughly 35 g CO₂e per km, yielding 16,000 km × 35 g/km ≈ 560 kg CO₂e per passenger.
- Low Occupancy: With lower load factors, this figure can roughly double – approaching ≈70 g CO₂e per km, for about 1,120 kg CO₂e per passenger per year.
Final Thoughts and Implications
- Monetary Cost: When traveling in an EV, sharing the riding cost among family members substantially lowers the per–person operating cost compared to the more rigid per–ticket fare for public transport.
- Energy Use: An EV “uses more” total energy per vehicle (8,640 MJ per year); even when you share that burden among 1.6 occupants it comes out higher on a per–person basis 1500 kWh (~5,400 MJ) compared with efficient, well–occupied public transport 480 kWh (≈1,728 MJ), about 70% less energy needed than an EV. However, when public transport is underutilized, its energy efficiency per passenger worsens substantially, but remains a third lower than an EV.
- Carbon Emissions: Under conditions of high occupancy, public transport’s low per–passenger emissions (≈560 kg CO₂e) compare fairly well with a shared EV (≈470 kg CO₂e). In contrast, off–peak or underused public transport may incur roughly double the per–passenger emissions. Additionally, the choice of green energy suppliers or the use of solar panels by EV owners can further tilt the balance in favor of EVs, reducing their carbon footprint to near-zero levels.
So, when you factor in occupancy differences, the answers can swing depending on usage conditions. In a family setting where an EV’s fixed energy use is distributed among several travellers, the environmental and cost benefits improve markedly. However, if you’re riding public transport outside of busy peak times, lower occupancy can erode its efficiency advantages.
In general public transport greatly reduces congestion and consumes less energy per person. However EVs are markedly cheaper and generally contribute much lower carbon emissions.
There’s a lot more nuance to this, of course. For instance, the impacts of multi–modal journeys, changes in grid carbon intensity over time, or how transit scheduling and demand management can further optimize public transport’s occupancy. Whether trains and buses are diesel or electric is a major consideration. Costs can be affected by rail cards and sophisticated tickets purchasing, while EVs low running costs are impacted if there is extensive use of public chargers. Such factors can tilt the overall “balance” depending on the use case.
This notwithstanding, personal choice and policy decisions regarding private versus public travel are not as simple as Public Transport= good, cars = bad. EVs can be far more cost effective and have lower emissions than public transport.

One response to “Public transport vs EV. Which should you use?”
[…] our previous post we looked at whether the suggestion that we should use public transport, especially to lower carbon […]
LikeLike